ANY-maze Help > The ANY-maze reference > The Tests page > The Experiment management reports > The Test charts report > Working with charts
Working with charts
![]()
Contents
| • | Altering the period the x-axis shows |
| • | Scrolling a chart from side to side |
| • | Altering the y-axis range |
| • | Scrolling a chart from up and down |
| • | Zooming in on a part of a trace |
| • | Returning to the previous view of a chart |
| • | Measuring values from a chart |
| • | Copying or saving a chart |
| • | Printing a chart |
Altering the period the x-axis shows
Charts always start off displaying a default period on the x-axis, exactly what this is will depend on how the chart was set up in the protocol, but typically it will be the entire duration of the test. This is useful as it allows you to quickly gain an idea for how the value being plotted changed across the duration of the test, but you will often want to 'zoom in' on a certain area of the chart and look at it in more detail and there are various ways to do this:
| • | You can simply place the mouse cursor over the x-axis at the time of interest and then roll the mouse wheel - this will 'zoom in' on the time that the mouse is pointing at. You can also zoom back out in the same way, just roll the mouse wheel in the opposite direction. |
| • | If you right-click over the chart a menu will open - one of the options on this menu is Set x-axis period, selecting this opens a sub menu from which you can select a standard period, such as 1 minute, 5 minutes, 1 hour, etc. The chart will update such that the time at the x-axis origin remains the same with the x-axis showing the specified period from that point on. |
| • | The other way to alter the x-axis width is to use the mouse to select an area of the chart (by clicking the left button and dragging). When you release the mouse the entire chart width will be used to show just the area you selected - try it, it's more intuitive than it sounds! One word of warning though, this will alter the y-axis too. |
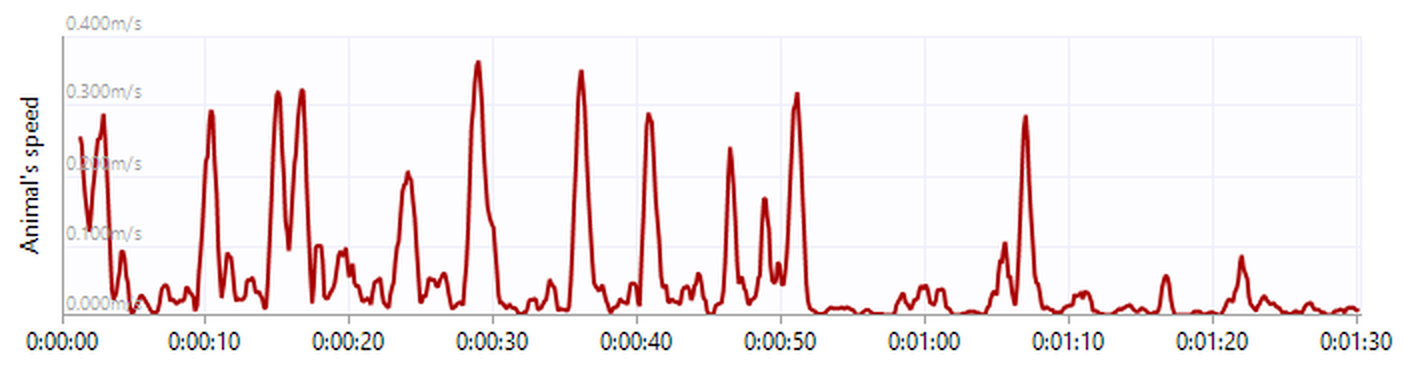
Figure 1. An example of a chart showing the animal's speed across the duration of a one and a half minute test.
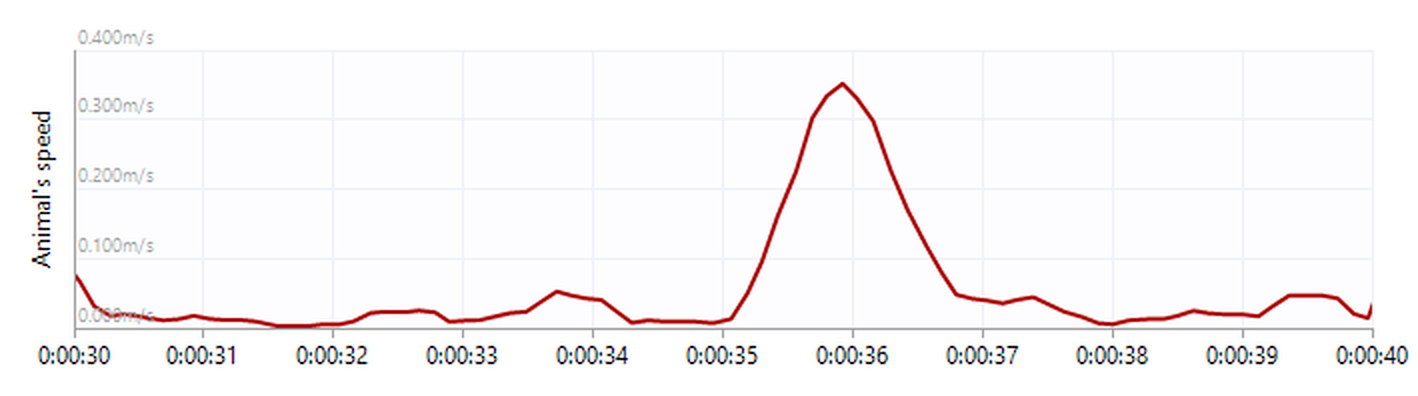
Figure 2. The same chart, but zoomed to show just the period from 30 seconds to 40 seconds.
Scrolling a chart from side to side
If you alter the width of a chart's x-axis (see previous section) then the chart will usually show just a part of the test's duration, so some parts of the trace will necessarily be off the chart to the left or to the right. To address this you can scroll the chart from side to side. To do this just move the mouse so it is over the x-axis and then drag the chart from side to side.
Altering the y-axis range
Charts usually automatically set their y-axis range so it runs from 0 to a value a little larger than the maximum value plotted. However, this might mean that you can't see details in some parts of the trace. For example, if you are looking at a chart which has small variations followed by a large peak, then the y-axis range will be large enough to show the peak, but that means you won't be able to see the detail in the small variations. To address this you can adjust the y-axis so that it covers a smaller range of values - the top of the peak will then be off the top of the chart, but you'll be able to see the detail of the variations.
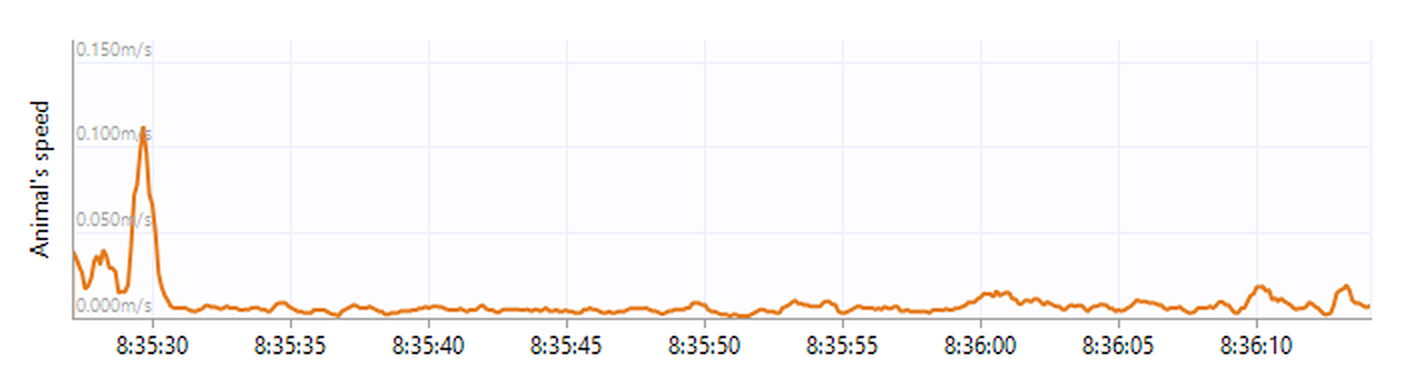
Figure 3. A chart with a large peak on the left. This has caused the y-axis scale to have a maximum of 0.15, making it hard to see any detail in the rest of the trace.
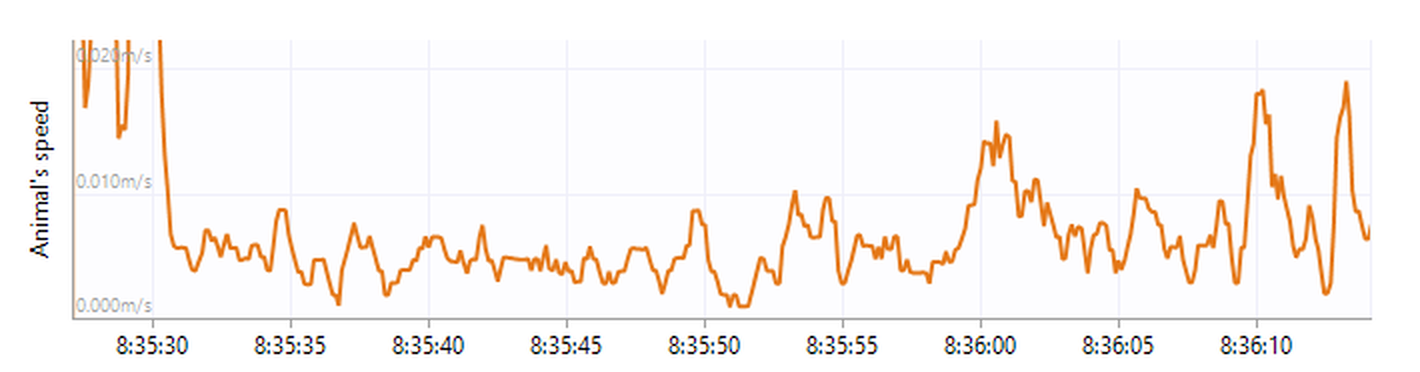
Figure 4. The same chart, but with the y-axis range reduced to have a maximum of 0.02 - the peak is off the top of the chart, but the detail in the rest of the chart can now be seen.
To change the range in this way, you need to move the mouse over the y-axis and roll the mouse wheel. Rolling it one way will 'zoom in', rolling it the other way will 'zoom-out'. As an alternative, you can use the mouse to select an area of the chart (by clicking the left button and dragging), when you release the mouse the x-axis will show just the area you selected. One word of warning though, this will alter the x-axis too.
To restore the y-axis to its default range, right-click on the chart and select Y-axis: auto-scale from the menu which appears.
Scrolling a chart from up and down
If you change the range of the y-axis (see previous section), the trace will probably have some parts which are 'off the top' (or 'off the bottom') of the chart. You can scroll the chart to make these parts of the trace visible, simply by dragging the y-axis up and down.
Zooming in on a part of a trace
To quickly zoom in on a specific part of the trace you can simply select it with the mouse. The x and y axes will then be scaled so that just the area of the trace that you selected is shown.
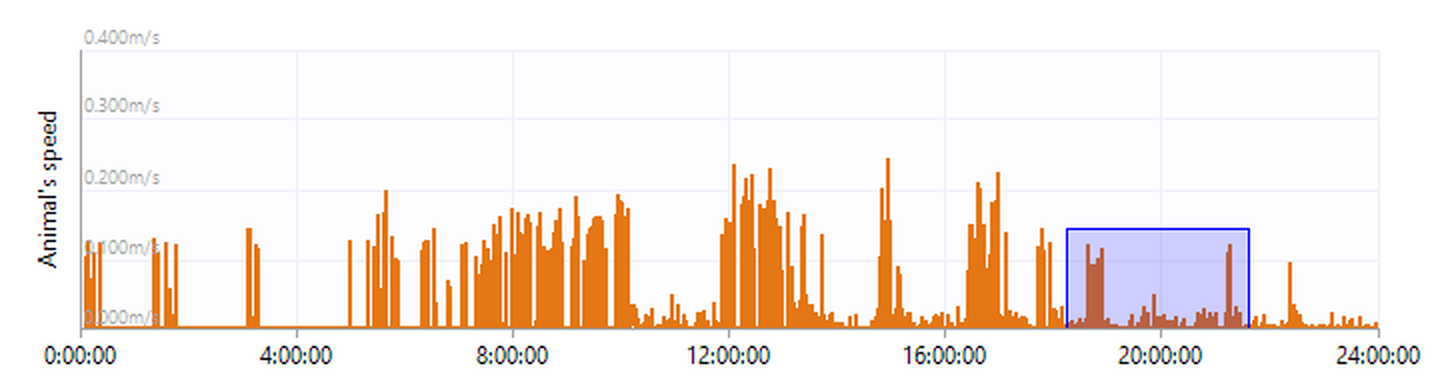
Figure 5. To zoom you just need to select a part of the trace with the mouse - this is the blue area shown here.
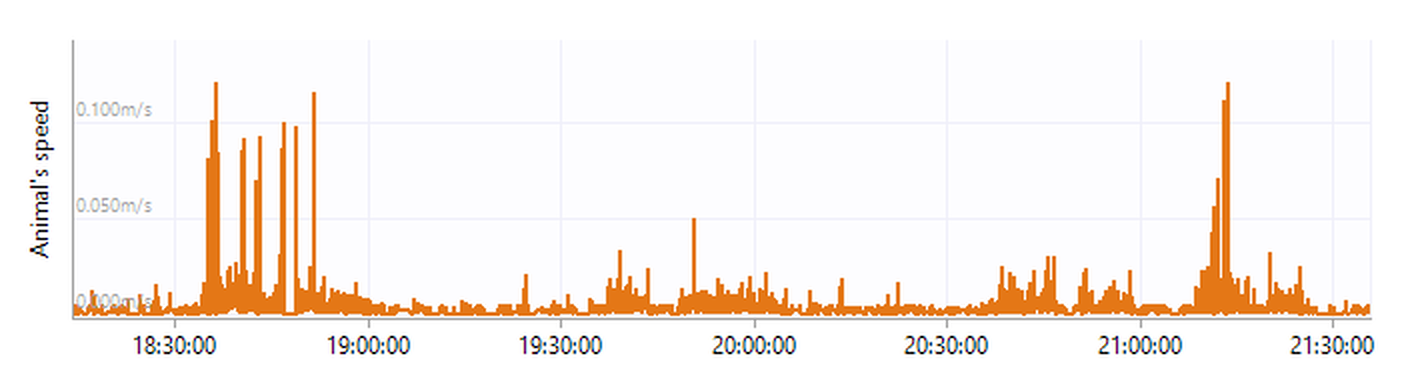
Figure 6. The same chart after the zoom. The chart now shows the just the area that was selected.
Returning to the previous view of a chart
After changing the range of either axis, scrolling or zooming-in you'll often want to return to the view of the chart you had before, fortunately this is easy to do - just right-click and select Previous view from the menu which appears.
Measuring values from a chart
In some circumstances you may want to measure a value from a chart. For example, you might be looking at a chart which shows to periods of 'activity' (like the chart in figure 7) and you may wish to know how long the gap between these two periods was.
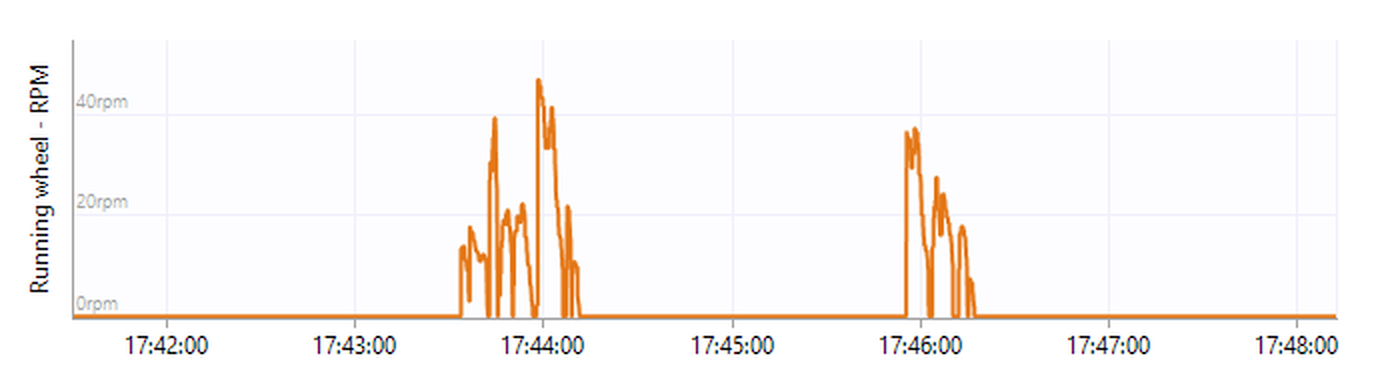
Figure 7. A chart showing two periods of 'activity'.
To find this out you can switch the chart into measurement mode by right-clicking on the chart and then selecting Measurement mode from the menu which appears. When in measurement mode you can use the mouse to select areas of the chart and view their details. For example, in figure 8, I've selected the area between the two periods of activity and I can see that this area covers the period from 17:44:12 (that's 17 hours, 44 minutes, 12 seconds) to 17:45:55, which is a period of 1 minute 43s.
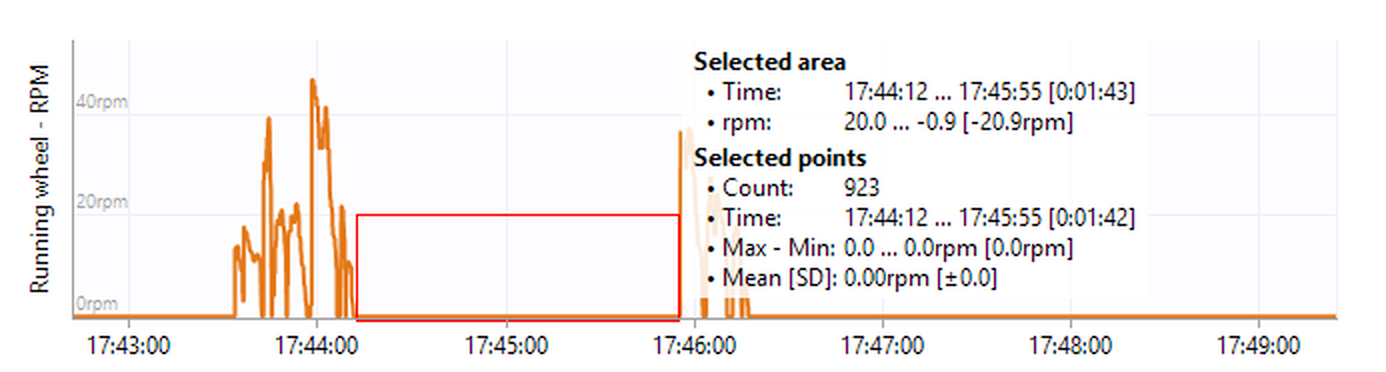
Figure 8. Using the chart 'Measurement mode' to measure the time between the periods of activity. The measurement data for the area selected shows that this covers a period of 1 minute 43 seconds.
The measure information shown for a chart describes two things: the area that was selected in the chart and the chart points which fall within that area. The difference here is that the area describes the area of the chart surface that was selected - this need not even have any of the trace in it, but it can still be reported as being a certain time in width and a certain value (in whatever the y-axis units are) in height. The points on the other hand, describe the actual data from the trace. Sometimes it's useful to see these points, which you can do by right-clicking over the chart and selecting Show points from the menu which appears (note that you must be in measurement mode for this option to appear on the menu).
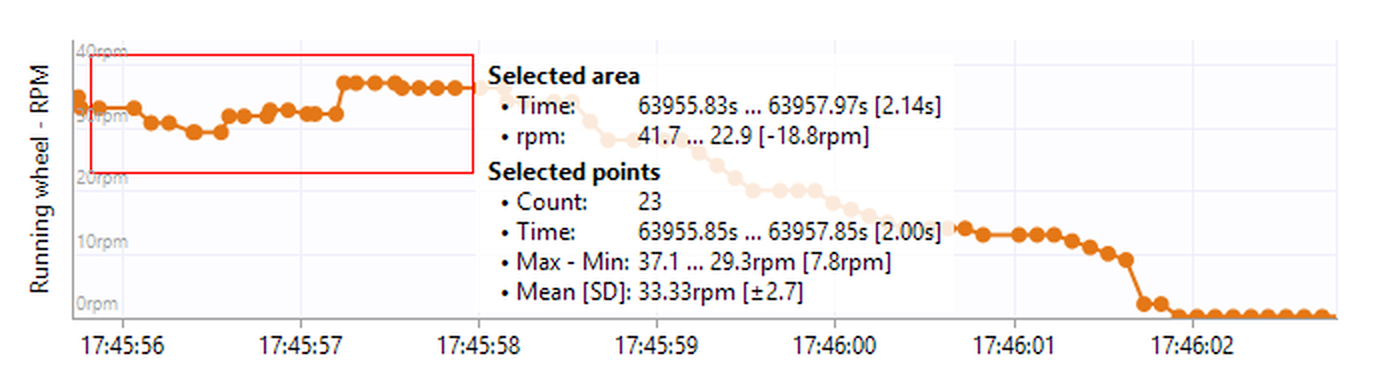
Figure 9. A chart in which the points are being shown. 'Measurement mode' shows us that the points within the selected area (the red box) cover a period of 2 seconds and have a range of 37.1 to 29.3 and an average of 33.33.
If you right click on the measurement data you'll find that the menu includes an option to Copy measurements which copies the measurements to the clipboard.
Copying or saving a chart
You can copy or save all the charts shown in a report by right-clicking on any of the charts and selecting Copy all charts or Save all charts from the menu which appears. If you want to copy of save a specific chart then you should right-click on that specific chart and then select Copy this chart or Save this chart from the menu which appears.
Charts can be saved in a variety of formats, which are described in detail in the Saving charts topic.
Printing a chart
Charts can't be printed on their own, but they can be printed as part of a report, such as the Tests chart report. In this case just selecting the ![]() Print... button in the ribbon bar will print the report.
Print... button in the ribbon bar will print the report.
See also:
| • | Saving charts |
![]()
© Copyright 2003-2026 Stoelting Co. All rights reserved
ANY-maze help topic T0779