ANY-maze Help > The ANY-maze reference > The Protocol page > The elements of a protocol > Analysis > Charts > Setting up chart state channels
Setting up chart state channels
![]()
Introduction
In addition to plotting a value, a chart can also be set up to shade its background to show certain 'states'. For example, in a chart showing the animal's speed, you could add a state channel to indicate whether or not the animal is in a particular zone. This way, you'll have a visual indication as to whether there is any correlation between the animal's speed and its presence in the zone.
An example of state channels can be seen in the following chart from an open field experiment, which has been set to show state channels for the animal being in the centre zone (green) and the animal being immobile (blue):
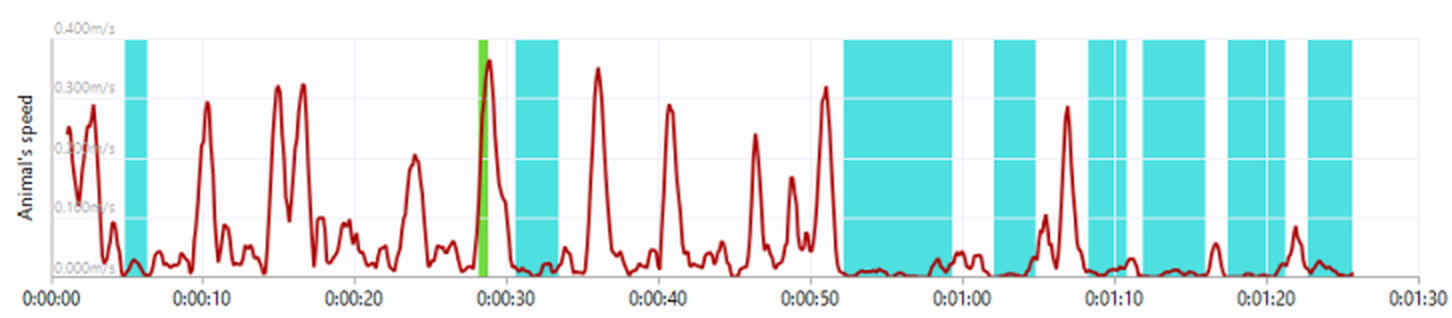
Figure 1. The background of the chart is shown in green when the animal was in the 'Centre' zone, and blue when the animal was immobile.
Details
When you add a chart to the protocol list, it will automatically include a sub-element called State channels. (If you can't see this element, you might need to expand the chart item by clicking on the arrow to its left).
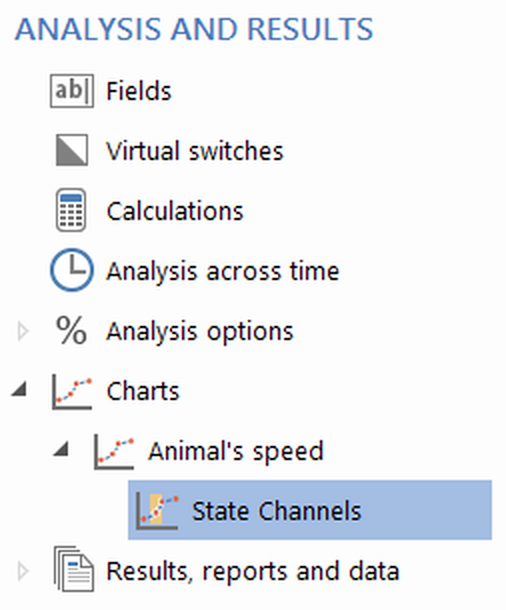
Figure 2. The State channels item appears under the chart in the protocol list.
Selecting the State channels sub-element will cause the settings pane to show a list of all the possible states that the chart can include. You simply need to select the states that you wish to display - you can select up to four. You can also change the colour used to indicate each state using the colour boxes at the bottom of the page.
Once you've set up the state channel(s) for a chart, the background of the chart will be shown in the specified colour whenever the state is active. If more than one 'state' is active at the same time, then the background will be shown as horizontal stripes of the colours of all the active states.
Editing a chart's state channels
You can edit anything about a chart's state channels either before, during or after an experiment has been performed.
Deleting a chart's state channels
It's not possible to delete a chart's State channels sub-element. If you don't want your chart to display any state channels, just de-select all the items in the state channels list.
![]()
© Copyright 2003-2026 Stoelting Co. All rights reserved
ANY-maze help topic T0668