ANY-maze Help > The ANY-maze reference > The Protocol page > The elements of a protocol > Reports > Results reports > Setting up a results report > Adding a section to a report
Adding a section to a report
![]()
In brief
Reports are made up of a number of individual sections. Each section performs analysis of a specific measure (or measures), and displays the results in a certain format. You must add at least one section to a report, otherwise it won't include any analysis at all.
To add a section, you should first ensure that the appropriate report is selected in the protocol list, then click the ![]() Add item button in the ribbon bar and select New report section from the menu which appears. You will then be able to choose the type of section you wish to add.
Add item button in the ribbon bar and select New report section from the menu which appears. You will then be able to choose the type of section you wish to add.
Details
Reports consist of one or more sections, each of which defines the measures to be analysed, any appropriate analysis options, and the format in which the results will be presented. There are four different section types you can add to a report:
| • | Text sections |
| • | Graph sections |
| • | Statistics sections |
| • | Track plot sections |
Text sections
A text section displays results in a simple text format. The data is collated into groups (for example, treatment groups) and for each group, the report can show the group N, mean, standard deviation, standard error, and the actual data - see figure 1.
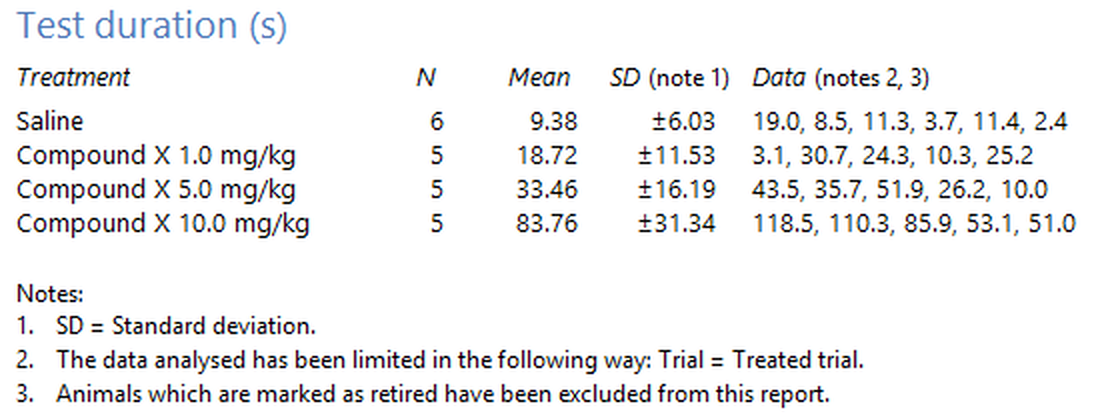
Figure 1. An example of a text section showing results for the 'Test duration' measure. The data have been grouped by treatment.
Graph sections
As you'd expect, a graph section shows results in a graphical format. Graphs show the means for individual groups and can optionally include error bars. You can show multiple series on a single graph if you want to - see figure 2.
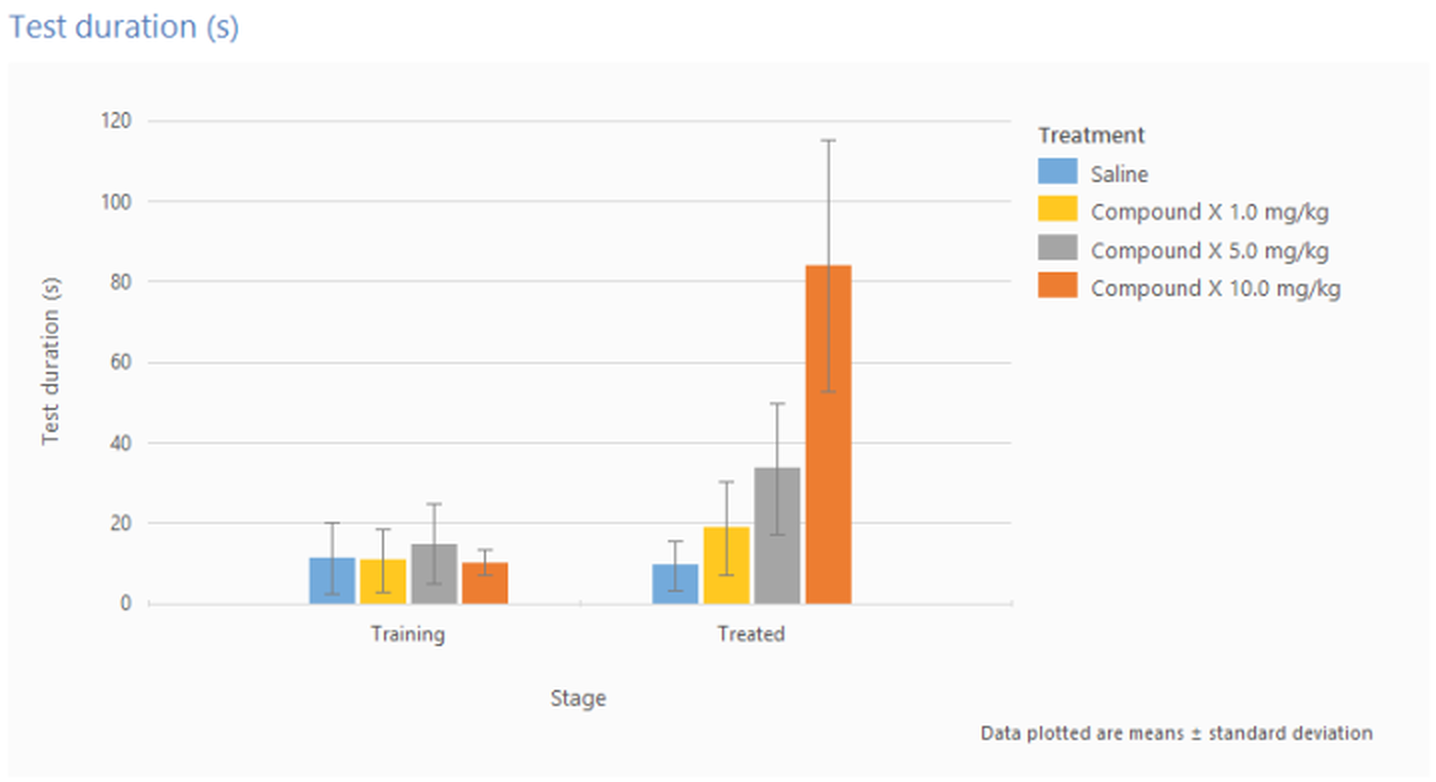
Figure 2. An example of a graph section showing results for the 'Test duration'. The graph shows stages on the x-axis, and uses different series for each of the experiment's treatment groups.
Statistics sections
Statistics sections are used to perform statistical analysis of your results. You can choose up to two independent variables and any number of dependent variables to be analysed and then select an appropriate statistical test from those provided by ANY-maze.
Track plot sections
Track plot sections don't actually perform any analysis as such, rather they show test track plots for different groups of tests - this can be an effective, although subjective, way to visualise test results. For example, showing track plots for different treatment groups in a water-maze can often make it very clear that some groups know where an island is and others don't.
Heat map sections
Like Track plot sections, heat map sections don't perform any analysis, instead they show heat maps for different groups of tests. They can either include one heat map for each test in the group, or show just a single, averaged heat map for each group.
For further details about the different sections, refer to the following topics:
| • | Setting up a text section of a report |
| • | Setting up a graph section of a report |
| • | Setting up a statistics section of a report |
| • | Setting up a track plot section of a report |
| • | Setting up a heat map section of a report |
There are no limits to how many sections you can include in a report. You can also include the same analysis in more than one section - this can be useful, for example, if you want to show the results both as text and as a graph.
Note that sections appear in the report in the order in which they appear in the report's definition within the protocol. So, for example, if you add a text section and then a graph section, the report will show the text first and then the graph. You can, however, reorder the sections if you want to, simply by dragging them within the protocol list.
![]()
© Copyright 2003-2026 Stoelting Co. All rights reserved
ANY-maze help topic T0706