|
ANY-maze Help > The ANY-maze reference > The Results page > Viewing results as graphs
Viewing results as graphs

 | For general information about the Results page, refer to the Results page topic. |
Introduction
As you would expect, graph reports show an experiment's results as a line, column or scatter graph. You can include multiple series on a single graph making it easy, for example, to see how a treatment affected results in different stages of an experiment.
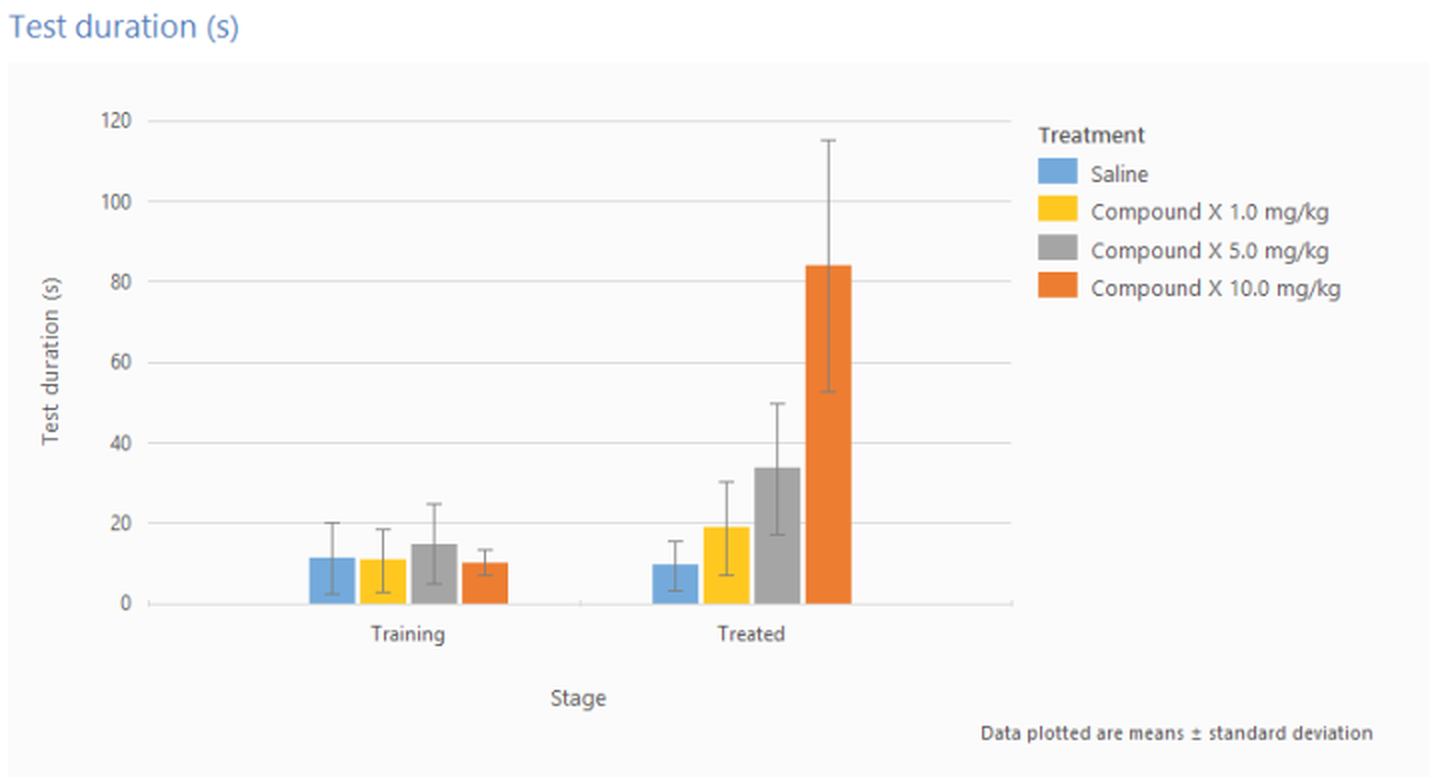
Figure 1. An example of a graph report.
To create a graph report you should:
| | 2. | Select the  Graph button in the Report style section of the ribbon bar. Graph button in the Report style section of the ribbon bar. | |
| | 3. | If the report settings are not already displayed, click the  Edit report settings button in the Actions section of the ribbon bar. Edit report settings button in the Actions section of the ribbon bar. | |
| | 4. | On the Graph report settings page you can: | |
| | 5. | Once you've specified the settings you want to use, you should click the  View the report button in the Actions section of the ribbon bar. View the report button in the Actions section of the ribbon bar. | |
See also:

© Copyright 2003-2026 Stoelting Co. All rights reserved
ANY-maze help topic T0841
|