ANY-maze Help > The ANY-maze reference > The Results page > Viewing results as heat maps > Choosing whether to show group average heat maps
Choosing whether to show group average heat maps

In brief
You can optionally show group average heat maps, these are heat maps in which all the data for a group of tests has been averaged to create a single heat map for the entire group, as in figure 1.
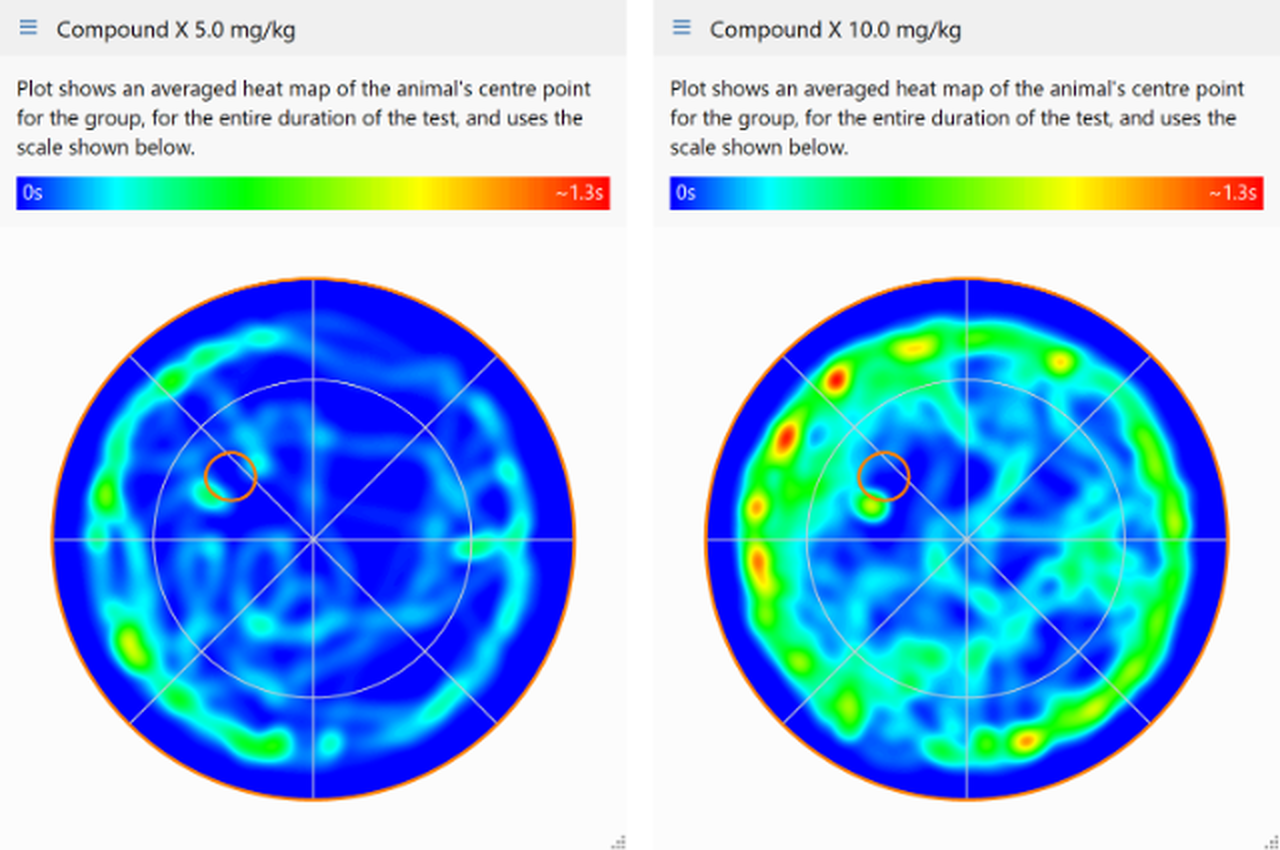
Figure 1. An example of an averaged heat map report. Here each heat map shows the averaged data for all the tests in the relevant group.
Details
To create group average heat maps simply select the Show averaged heat maps for the groups option on the Heat map report settings page
For this to work, the heat maps for each test need to align, which may not be the case if some of the tests were performed in different apparatus or if different tests have a moveable zone in different locations. To address these issues, you can apply transforms to heat maps, you'll find full details about applying transforms to apparatus here and about applying transforms to align zones, here.
The  Clear report settings button in the ribbon bar can be used to reset all the report settings back to their defaults.

© Copyright 2003-2026 Stoelting Co. All rights reserved
ANY-maze help topic T0862