ANY-maze Help > The ANY-maze reference > The Protocol page > The elements of a protocol > Behaviour > Zones > Setting up a zone > Applying transforms based on a zone's location so all apparatus maps align
Applying transforms based on a zone's location so all apparatus maps align

In brief
When you set up a moveable zone ANY-maze will include an option to Align apparatus in track plots and heat maps based on this zone's position. Selecting this option will cause the zone's positions to include fields where you can specify the transforms required to achieve alignment.
Details
In some apparatus you may have a zone whose location varies between tests, the platform in a water-maze is a good example.
ANY-maze copes with these moveable zones by allowing you to set up multiple positions that they can adopt, and then specifying which position the zone is in for each test. For example, in the water-maze the platform might be in the top left of the apparatus in some tests and in the bottom right in others.
After you have performed a test ANY-maze can draw track plots and heat maps which show where the animal went in the test and how much time it spent in different parts of the apparatus. In the water-maze example, the animal might be expected to spend a significant amount of time in the quadrant of the maze which contains the platform and this will be reflected in the track plots and, most notably, in the heat maps.
However, because the platform can be in one of two locations within the maze, in some of the plots you would expect the animal to spend more time in the top left quadrant and in others in the bottom right; this will make it hard to compare the plots, as you'll keep having to check where the platform was located.
To address this, you can specify that you would like to apply transforms to the plots based on the location of the platform zone. Then for the top left position you would specify that no transforms should be applied, but for the bottom right position you'd specify that the plots should be rotated by 180° - thus causing them to align with the top left platform position. Now all the plots will be drawn as if the platform was in the same location, making them much easier to compare.
This is especially important if you want to plot group average heat maps, where all the heat maps for tests in a group of animals (typically, but not necessarily, the treatment groups) are plotted together, to show the average heat map for the group. In this case it is imperative that the plots are logically aligned, otherwise the result will be meaningless - see figure 1.
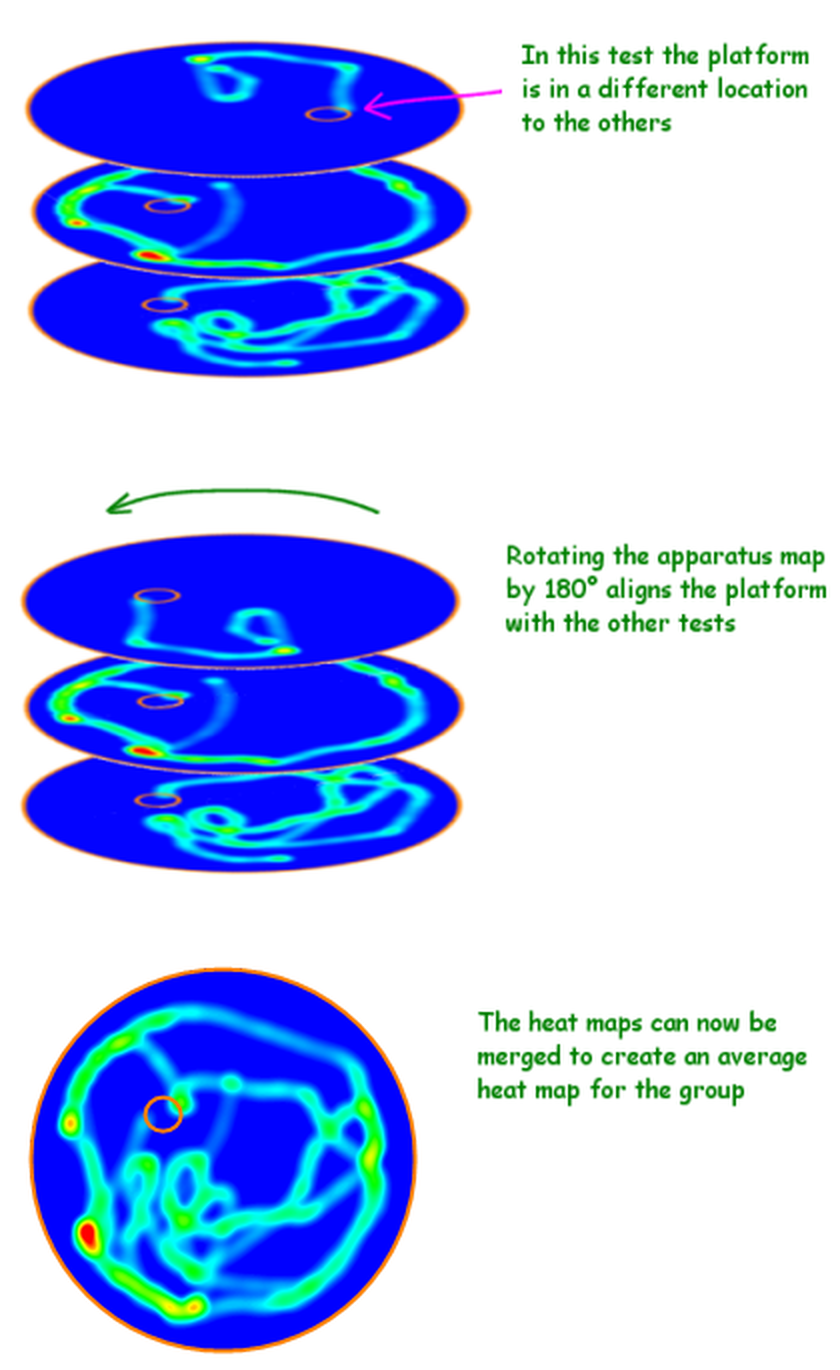
Figure 1. By applying a rotation transform to the test with the platform in the bottom right, we can make the platforms align.
See also:
| • | Specifying transforms when setting up a zone's positions |

© Copyright 2003-2026 Stoelting Co. All rights reserved
ANY-maze help topic T0324