ANY-maze Help > The ANY-maze reference > The Results page > Viewing results as track plots
Viewing results as track plots
![]()
| For general information about the Results page, refer to the Results page topic. |
Introduction
Track plot reports show grouped plots of the animal's tracks in their tests. The grouping of the plots can help to highlight their differences - see figures 1.
| You'll find a general introduction to track plots here. |
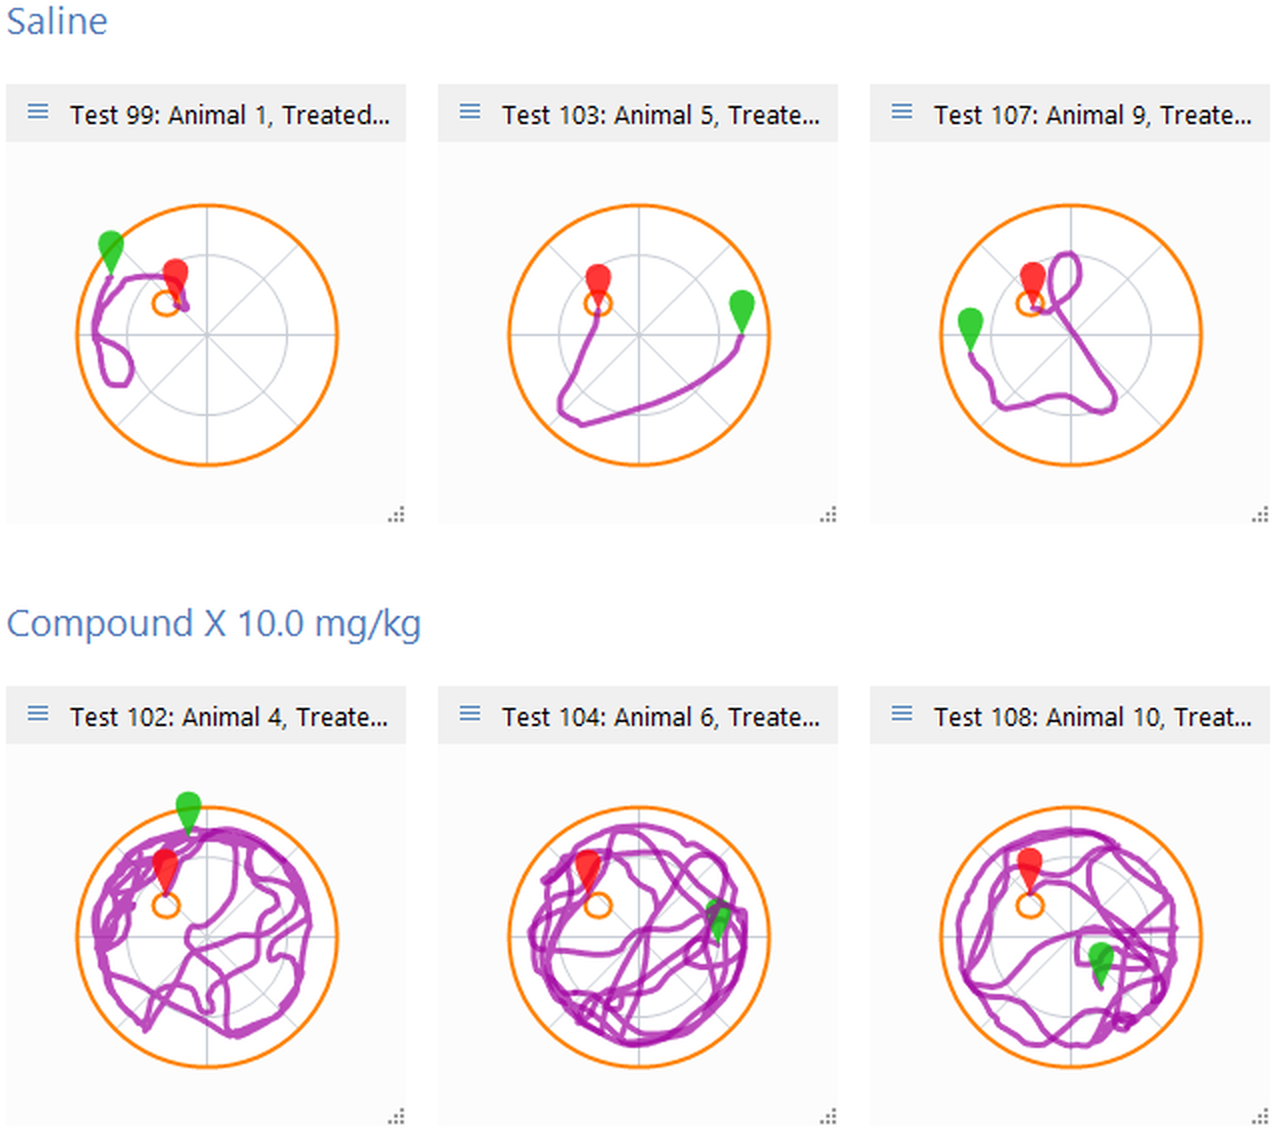
Figure 1. An example of a track plot report showing plots for two different groups of animals in a water-maze test.
To create a track plot report you should:
| 1. | Switch to the Results page. |
| 2. | Select the |
| 3. | If the report settings are not already displayed, click the |
| 4. | On the Track plot report settings page you can: |
| • | Select the specific track plot map to show in the report |
| • | Specify how you want the track plots to be grouped |
| • | Limit the tests included in the report |
| 5. | Once you've specified the settings you want to use, you should click the |
![]()
© Copyright 2003-2026 Stoelting Co. All rights reserved
ANY-maze help topic T0856