ANY-maze Help > I/O devices supported by ANY-maze > Test equipment designed specifically for ANY-maze > The Orofacial pain assessment device (OPAD) cage > Performing experiments with the OPAD cage > Analysing the results of OPAD experiments
Analysing the results of OPAD experiments
![]()
Introduction
As we saw in the previous topic of this tutorial, ANY-maze shows the results of individual tests in the Test details report. However, you will usually want to view and analyse the results of all the tests in an experiment together and we will learn how to do just that in this topic. But first, we will look in a little more detail at what results ANY-maze can report for tests performed in the OPAD cage.
| • | OPAD cage results |
| • | Viewing collated results |
| • | Performing statistical analysis of results |
| • | Analysing tests across time |
| • | Moving your results elsewhere |
OPAD cage results
The results that ANY-maze reports for an OPAD cage fall into two groups - standard results and OPAD specific results.
The standard results are the results that ANY-maze reports for any type of apparatus, and in the case of an OPAD cage, these mainly relate to the lick and contact sensors and the liquid consumption.
For the lick and contact sensors, ANY-maze can report, amongst other things:
| • | Total number of activations |
| • | Total time active |
| • | Latency to first activation |
| • | Longest activation |
A complete list can be found here.
If the OPAD used for the test includes a weight sensor, then for 'drink consumption' ANY-maze reports the change in weight - that's to say the amount of liquid the animal consumed during the test.
The more interesting results are those that are specific to OPAD, which include Temperature when contact broken and various results for Temperatures of interest. These special results are in fact configurable using options specified in the protocol. To access these options, you need to navigate in the protocol list to Analysis > Analysis of OPAD results, as shown in figure 1.
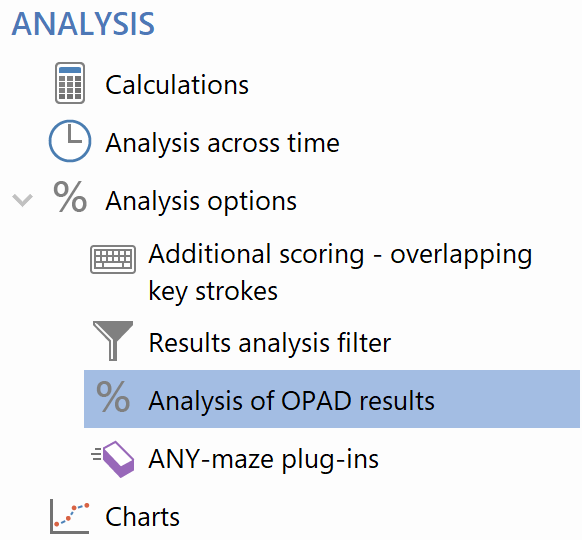
Figure 1. The Analysis of OPAD results option in the protocol list
Selecting Analysis of OPAD results in the protocol list causes the settings pane to display the options shown in figure 2.
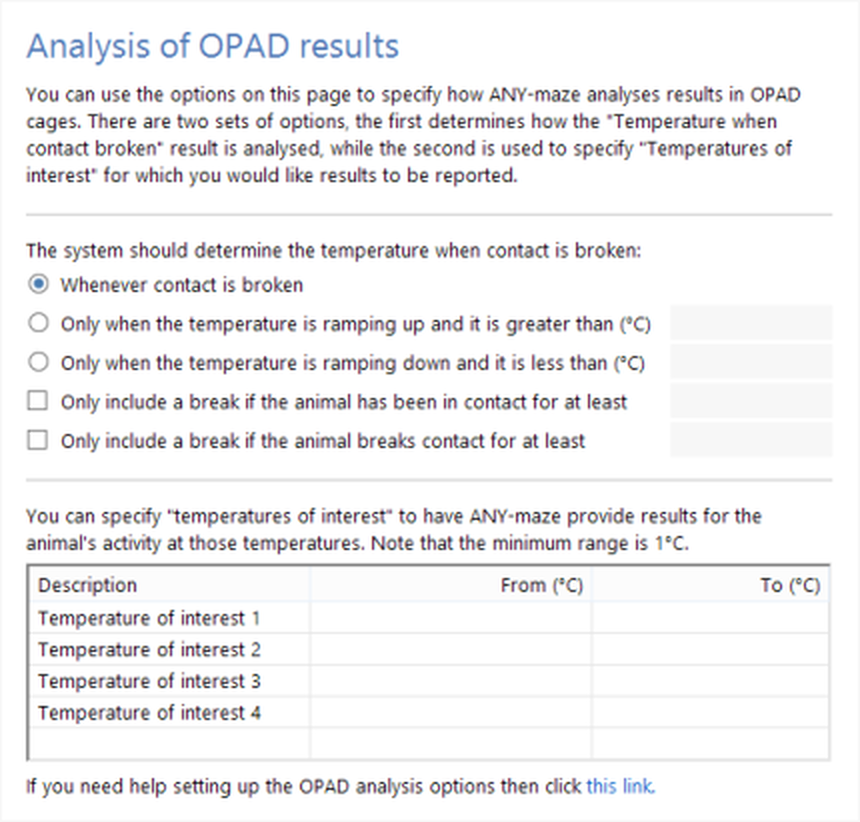
Figure 2. The Analysis of OPAD results settings
Temperature when contact broken
The Temperature when contact broken essentially reports the temperature of the OPAD cage thermal elements when the animal broke contact - which usually occurs because the thermal stimulus had become too aversive. Of course, an animal might make and break contact multiple times - the result reported is the average for all the occasions when the animal broke contact.
You can, however, configure this result using the options shown in figure 2. First, you have the ability to specify that the average value should only include breaks that occur when the temperature is ramping up (getting hotter) and is above some specific value. Or you can choose the same sort of option for when the temperature is ramping down and is below some specific value. This allows you to ignore breaks that occur when the temperature is 'returning' to its base level. For example, imagine you have set the thermal elements to start at 25°C and then to ramp up to 50°C before returning back to 25°C again - you repeat this sequence throughout the test. Probably you would only be interested in the temperature at which the animal breaks contact when the temperature is increasing and not when the temperature is dropping back to the base level of 25°C.
You can also filter the breaks that get included in the result so as to exclude breaks which last a very short time or breaks which occur after the animal has only been in contact for a very short time. The first option is useful as it avoids including breaks which only occurred because the animal was, for example, adjusting its position and not really moving away from the thermal stimulus. The second option avoids including breaks that occur when the animal makes an 'attempt' to touch the thermal elements - for example, the element might be ramping up and when it reached 45°C, the animal broke contact, but the animal might wait a moment and then try touching the element again. If it is still at 45°C (or perhaps even hotter), then the animal will probably immediately break contact and you wouldn't want to consider this very short 'contact' in your results.
Temperatures of interest
As the name implies a Temperature of interest is a temperature range which interests you. For example, you may have determined that animals typically break contact with the thermal element when it is at around 40°C, but when you give them a certain drug this increases to 50°C. This being the case, you might decide to create two 'temperatures of interest', one for the range 35-45°C and another for the range 45-50°C. (Note that you can create any number of these ranges, and they can overlap; the only rule is that each range must span at least 1°C).
For each temperature of interest that you define, ANY-maze will report:
| • | Time in contact |
| • | Number of times contact broken |
| • | Number of times contact made |
| • | Number of licks |
OPAD cage analysis options can be changed at any time
A very important thing to understand about these options is that you can change them at any time, including AFTER tests have been performed. For example, imagine you performed an experiment consisting of 100 tests. After the experiment you realise that it would have been useful to look at the animals' behaviour when the thermal elements were around 40°C. You DON'T need to perform all 100 tests again; instead you can just switch to the protocol, add a temperature of interest for the range 38-42°C (or whatever) and the results will immediately be available.
The same thing applies to the settings for Temperature when contact broken.
Viewing collated results
Earlier in this tutorial we saw how we could view results for individual tests, but you will typically want to look at results that are collated into groups - for example, treatment groups or perhaps stages of the experiment. This is what the ANY-maze Results page is for.
To switch to the Results page, just click the Results tab above the ribbon bar.
Let's imagine we want to compare the Temperature when contact broken between our different treatment groups - to do this, we would make the selections shown in figure 3.
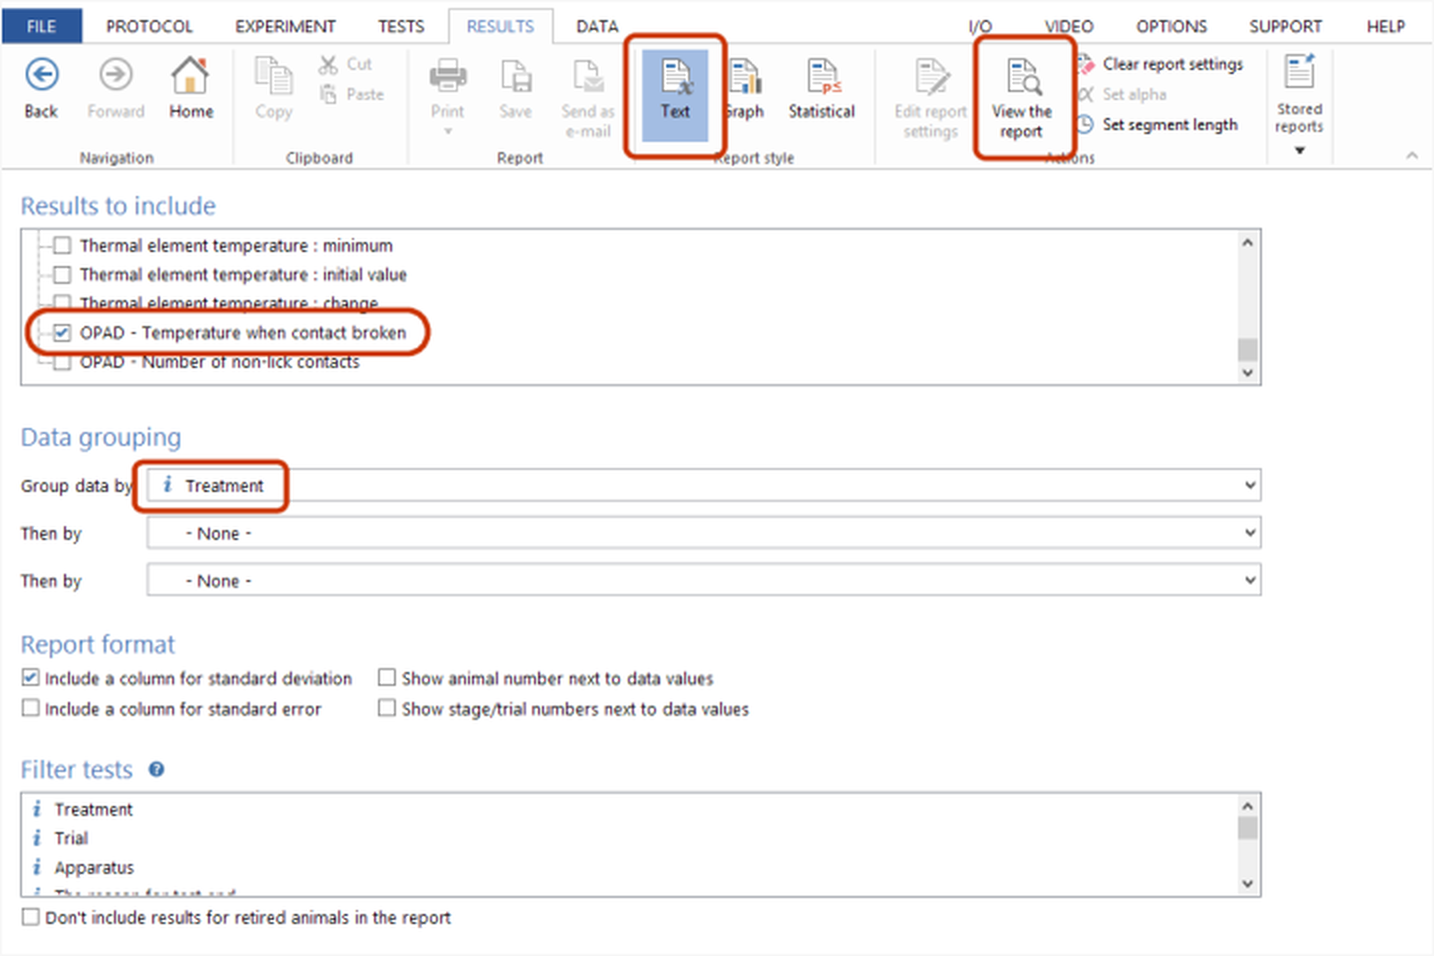
Figure 3. Settings to show the results of 'Temperature when contact broken' for all tests in the experiment, collated by Treatment group.
When you click the ![]() View the report button you would see something like the report shown in figure 4. I say 'something like', because of course if you are following the steps in this tutorial then your experiment will only include a few completed tests (if any) so you won't see very many results.
View the report button you would see something like the report shown in figure 4. I say 'something like', because of course if you are following the steps in this tutorial then your experiment will only include a few completed tests (if any) so you won't see very many results.
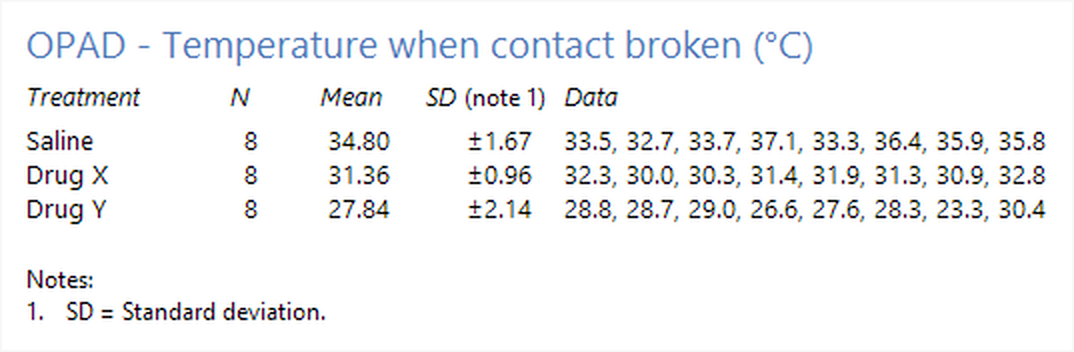
Figure 4. An example of the type of report that is shown when using the settings in figure 3.
You may notice that the ribbon bar includes a section titled Report style. The report shown in figure 4 is a Text style report, but simply by selecting the Graph style, we can view the same data as a graph - see figure 5.
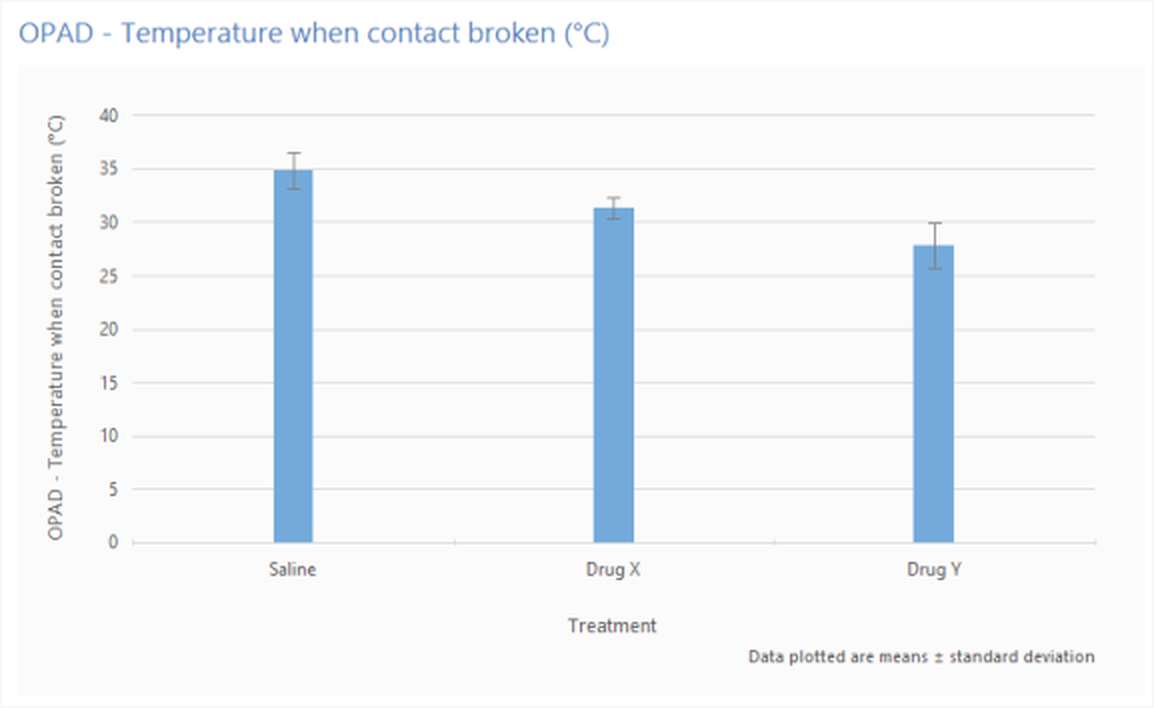
Figure 5. The same results as figure 4, but shown as a graph rather than text.
Performing statistical analysis of results
In the previous section we looked at the Text and Graph report styles, but there's another style called Statistical. As the name implies, this will perform statistical analysis of your data - figure 6 shows the same data as figure 4 and 5, but analysed using a 1-way ANOVA followed by Tukey's post-hoc test.
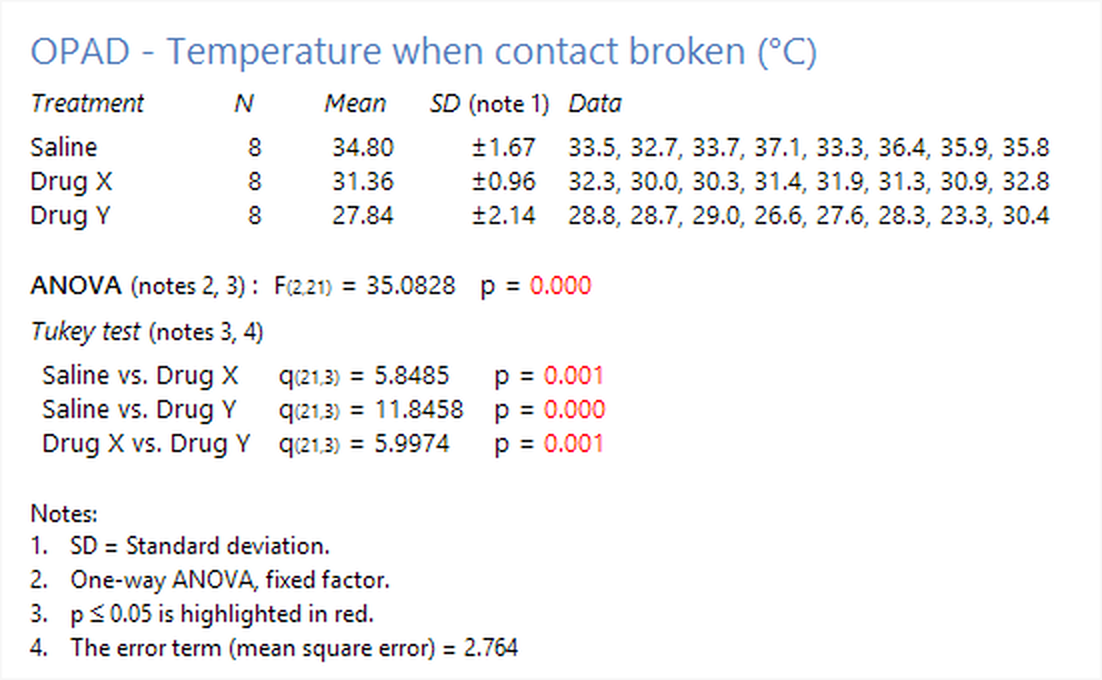
Figure 6. Statistical analysis of the results shown in figures 4 and 5.
The full range of statistical analysis options are beyond the scope of this tutorial, but suffice to say that ANY-maze includes more than 40 different stats tests including a wide range of post-hoc tests. We don't pretend that ANY-maze is a replacement for a full stats package such as SPSS, but it does provide a quick and easy way to analyse your results and it doesn't require very much knowledge of stats, as it automatically ensures that the stats tests used suit the data being analysed.
Nevertheless, you will probably still want to extract your data from ANY-maze so you can analyse it elsewhere, and this is the subject of the last section of this tutorial.
Analysing tests across time
Usually ANY-maze will report results for entire tests, so you will see data for things like Temperature when contact broken for the whole test duration. However, you may wish to see how the animals' behaviour changed across the duration of the tests - in other words you may want results for different parts of the test, rather than for all of it.
ANY-maze provides two mechanisms for analysing tests across time: you can divide the tests into equal duration segments (sometimes called 'time bins') and then analyse results between the segments, and/or you can define different Time periods and then analyse results for each period individually. Both of these option are described in detail in the Analysis across time topic.
Moving your results elsewhere
While the Results page described in the previous section can show all the results of an experiment, it does this in a format that's designed to be easy for you to understand, but which is not very amenable to export to other programs. To view results in a more 'exportable' format you need to switch to the Data page (by clicking the Data tab above the ribbon bar).
The data page shows the results of an experiment in a spreadsheet format - see figure 7.
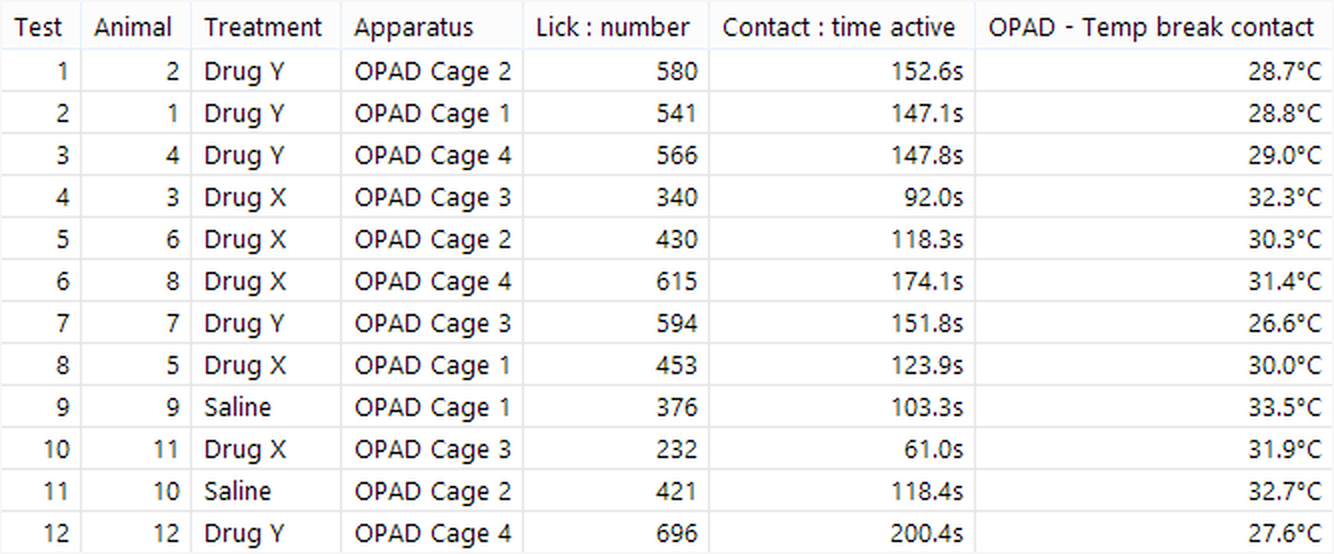
Figure 7. Example of the data page spreadsheet.
The rows of the spreadsheet are the individual tests, while the columns are the results. You can use the ![]() Select data button to switch to a page where you can select the columns you want included and/or filter the tests, so, for example, only tests for a certain treatment are shown.
Select data button to switch to a page where you can select the columns you want included and/or filter the tests, so, for example, only tests for a certain treatment are shown.
The spreadsheet can be copied, simply by right-clicking and selecting Copy... from the menu which appears, and then pasted directly into programs such as Excel or SPSS. You can also save the spreadsheet to a file, again by right clicking and selecting Save... from the menu which appears.
That's all folks!
That wraps up this OPAD tutorial. If you've read the whole thing, then you should now have a fairly good idea about how OPAD and ANY-maze work, and you can probably get started right away performing your experiments.
If you have questions, then you'll find that the help contains a huge amount of information, which you can search. You'll also find that help is context sensitive, that's to say if you switch to the Help page you will be shown help on whatever it is that you're doing at the time. (Note that context sensitivity can be switched on and off using an option in the Window section of the Help page ribbon bar.)
And if you can't find the answer to a question, then just contact ANY-maze Support - we're always happy to help and we usually respond to questions very quickly.
See also:
| The topics listed below are general topics relating to ANY-maze, and may refer to features not available or required with an OPAD. |
| • | Viewing results |
| • | Performing statistical analysis |
| • | Printing, copying and saving results |
| • | Transferring data to other programs |
![]()
© Copyright 2003-2026 Stoelting Co. All rights reserved
ANY-maze help topic T1203