ANY-maze Help > The ANY-maze reference > The Tests page > The Experiment management reports > The Test track plot reports > Working with Track plots
Working with Track plots
![]()
Introduction
There are lots of ways to interact with track plots, including editing what they show, resizing them, 'playing' the track and copying and saving their contents.
| You'll find a general introduction to track plots here. |
| • | The track plot menu |
| • | Editing what the plot shows |
| • | Resizing a track plot |
| • | Showing and hiding the legend |
| • | Applying transforms |
| • | Playing track plots |
| • | Copying a plot |
| • | Saving a plot to a file |
| • | Saving a plot as a vector image |
| • | Saving a plot as a movie |
| • | Printing a track plot |
The track plot menu
The track plot menu is accessed by clicking the ![]() menu button in the track plot's title bar. The menu contains the following options:
menu button in the track plot's title bar. The menu contains the following options:
| Starts the track plot playing |
| Opens the track plot settings pop-up window, where you can edit the plot |
| Toggles display of the track plot legend on and off |
| Toggles whether transforms are applied to the track plot |
| Copies the track plot to the clipboard |
| Saves a picture of the track plot to a file |
| Saves the track plot in SVG (Scalable Vector Graphics) format to a file |
| Saves the track plot as a movie |
| Opens this help topic |
Playing track plots
Playing a track plot replays the animal's movement during the test. As the animal maker moves it leaves the track behind, creating a trail. In fact, you can alter the length of trail, which can be very useful in long duration tests. Any markers included in the plot are also shown during the playback, appearing at the time the event they are marking occurred.
During playback, the title of the track plot changes as shown in figure 1.
![]()
Figure 1. When playing a track plot the title changes to show playback controls.
| Pauses playback and changes the button to a start button. |
| Restarts playback when it is paused |
| When playback ends, rewinds it to the start of the test and begins it playing |
| Ends playback and removes the playback controls from the title bar |
| Opens a menu of playback speeds. The playback can be sped up (useful for long duration tests) or slowed down (useful when you want to study exactly where the animal went) |
During playback, the title bar also shows the test clock and a playback slider. You can drag the slider to jump to any part of the test, this works both during playback and when playback is paused.
If you have set the plot to only include certain parts of the test, then the playback slider will still show the entire duration of the test, but the parts that are excluded will be shown in a paler colour - as is the case in figure 1. Playback will jump over these excluded parts.
It is also possible to save a plot as a movie.
Editing what the plot shows
Track plots are set up as part of the protocol and you can, of course, edit them in the protocol page at any time. However, a more interactive way of editing a plot is to use the ![]() Change settings option on the Track plot's menu. This opens the Track plot settings pop-up window next to the track plot itself - see figure 2.
Change settings option on the Track plot's menu. This opens the Track plot settings pop-up window next to the track plot itself - see figure 2.
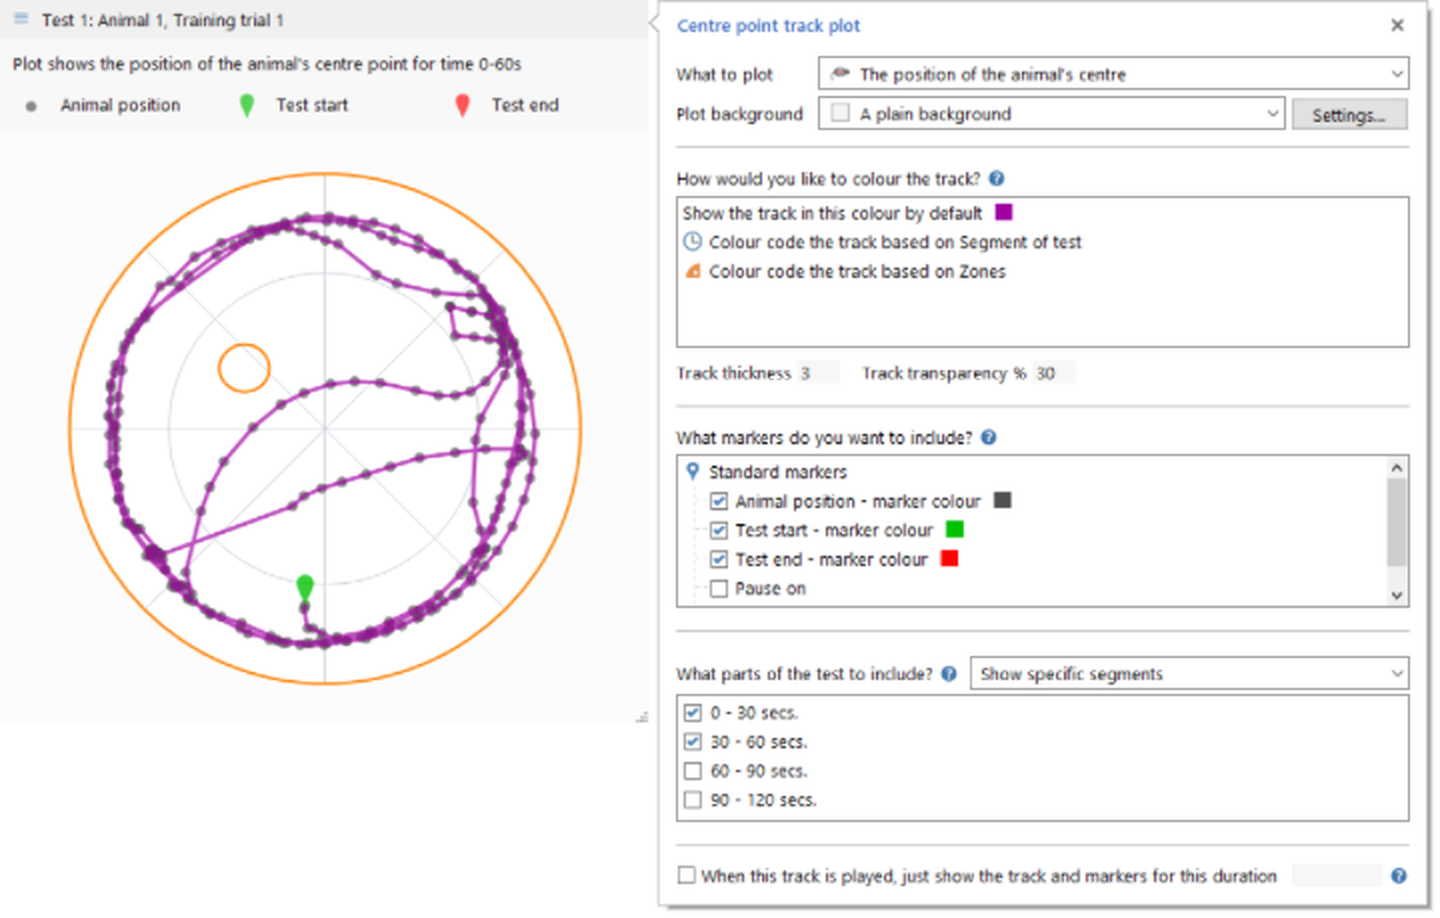
Figure 2. The Track plot settings pop-up window
A great feature of the Track plot settings pop-up window is that as you make changes in the window they are immediately reflected in the track plot, making it very easy to adjust the plot's format and contents to exactly what you want.
The options available in the pop-up window mirror those available in the Track plot settings in the protocol:
| • | Changing what the track plot should show |
| • | Altering the colour, width and transparency of the track |
| • | Selecting markers you would like shown on the plot |
| • | Specifying the part(s) of the test to plot |
| • | Altering the playback duration for the plot |
Resizing a track plot
It's very easy to resize a track plot, just drag the resizer in the bottom-right corner of the plot's background. Changes to a plot's size persist, so if you close a track plot report and later reopen it, the plot will still be the same size.
If you resize a plot on the Results page all the plots in the report (of the same type) will also resize. Again the plot's size will be retained, although the size of a plot on the Results page, can be different to the size in the Test track plot report.
Showing and hiding the legend
You can show and hide the track plot legend simply by selecting the appropriate option from the Track plot menu. The legend includes details of what the plot is showing, and where relevant, indicates what the track colours, and any markers, represent.
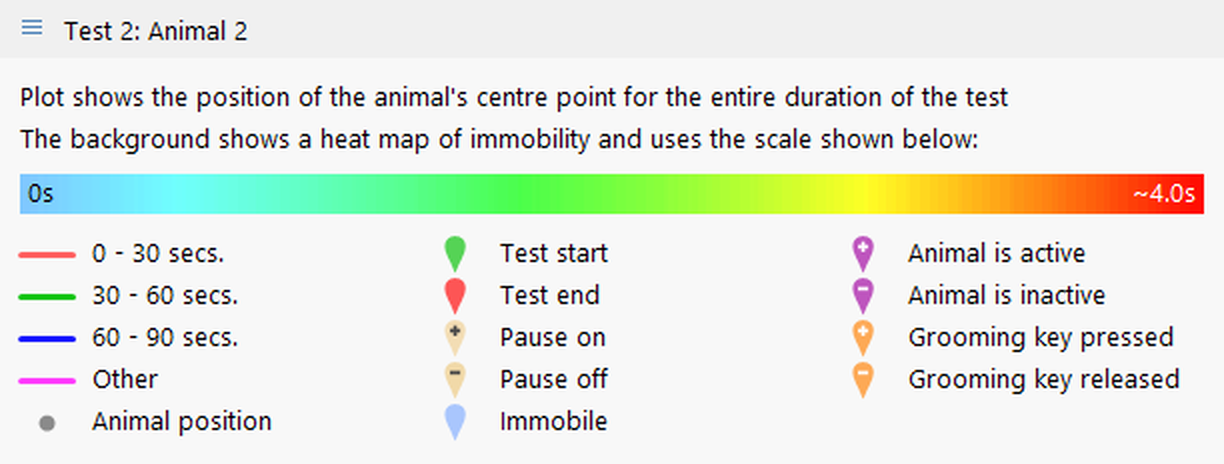
Figure 3. The legend provides a complete 'key' as to what is shown in the plot.
Applying transforms
If you have defined any apparatus transforms or any moveable zone transforms, then the Track plot menu will include an option to Apply transforms, which can be used to toggle whether the transforms are actually applied to the plot you are viewing. Note that you can only choose to have all transforms applied or none.
Copying a plot
You can copy a track plot to the clipboard either by selecting the ![]() Copy plot option from the Track plot menu, or by right clicking anywhere on the plot and selecting the Copy plot option from the menu that appears.
Copy plot option from the Track plot menu, or by right clicking anywhere on the plot and selecting the Copy plot option from the menu that appears.
The entire plot is copied, including the title bar and the legend, if shown. If the plot is playing at the time it is copied, the title bar in the copy does not show the playback controls, it shows the plot's title.
Saving a plot as a picture
To save a plot as a picture, either select the ![]() Save plot as a picture option from the Track plot menu, or right click anywhere on the plot and select the Save plot as a picture option from the menu that appears. A standard Save file window will open where you can choose the file and format to save in. More details, including a description of the various formats available, can be found here.
Save plot as a picture option from the Track plot menu, or right click anywhere on the plot and select the Save plot as a picture option from the menu that appears. A standard Save file window will open where you can choose the file and format to save in. More details, including a description of the various formats available, can be found here.
Note that the entire plot is saved, including the title bar and the legend, if shown. If the plot is playing at the time it is saved, the title bar in the saved image does not show the playback controls, it shows the plot's title.
Saving a plot as a vector file
To save a plot as a vector file, either select the ![]() Save plot as a vector file option from the Track plot menu, or right click anywhere on the plot and select the Save plot as a vector file option from the menu that appears. A standard Save file window will open where you can choose the file to save to.
Save plot as a vector file option from the Track plot menu, or right click anywhere on the plot and select the Save plot as a vector file option from the menu that appears. A standard Save file window will open where you can choose the file to save to.
The file will be saved in SVG (Scalable Vector Graphics) format which can be displayed in web browsers, can be imported and scaled in Word, PowerPoint, etc. and can be edited by programs such as Adobe Illustrator, CorelDRAW and Inkscape (which is free).
Note that the entire plot is saved, including the title bar and the legend, if shown.
There are some limitations to saving track plots as vectors:
| • | The vector file will display the apparatus background with the currently selected background colour, it will not show background images or heat maps. |
| • | If part of the border of the apparatus is defined using 'single lines' (not ellipses, rectangles, or multilines), any grid may not be drawn correctly. |
| • | If the plot is playing at the time it is saved, the title bar in the saved image will not show the playback controls, it will show the plot's title. Also the saved plot will represent the track as if it were not being played. |
Saving a plot as a movie
As well as being able to play a track plot you can also save the playback as a movie, which, for example, you could then include in a PowerPoint presentation.
To save a plot as a movie either select the ![]() Save plot as movie option from the Track plot menu, or right click anywhere on the plot and select the Save plot as a movie option from the menu that appears.
Save plot as movie option from the Track plot menu, or right click anywhere on the plot and select the Save plot as a movie option from the menu that appears.
A standard Save file window will open where you can choose the file and format to save in. Two formats are supported WMV and MP4.
Printing a track plot
You can't print a track plot in isolation, but you can print the plot together with the report it is part of - either a Test track plot report or a Results report. In either case you simply need to select the ![]() Print button in the ribbon bar.
Print button in the ribbon bar.
![]()
© Copyright 2003-2026 Stoelting Co. All rights reserved
ANY-maze help topic T0773