ANY-maze Help > I/O devices supported by ANY-maze > The ANY-maze Operant interfaces > A tutorial on the ANY-maze Operant interface > Operant interface tutorial : Analysing results
Operant interface tutorial : Analysing results
![]()
Introduction
As we saw in the previous topic of this tutorial, ANY-maze shows the results of individual tests in the Test details report. However, you will usually want to view and analyse the results of all the tests in an experiment together, and we will learn how to do just that in this topic.
| • | Viewing collated results |
| • | Performing statistical analysis of results |
| • | Analysing tests across time |
| • | Moving your results elsewhere |
Viewing collated results
Earlier in this tutorial we saw how we could view results for individual tests, but you will typically want to look at results that are collated into groups - for example, treatment groups or perhaps stages of the experiment. This is what the ANY-maze Results page is for.
To switch to the Results page, just click the Results tab above the ribbon bar.
Let's imagine we want to compare the Lever : Number of activations result between our different treatment groups - to do this, we would make the selections shown in figure 1. (If the Results page doesn't currently look like this, just set the Report style to Text and click the ![]() Edit report settings button).
Edit report settings button).
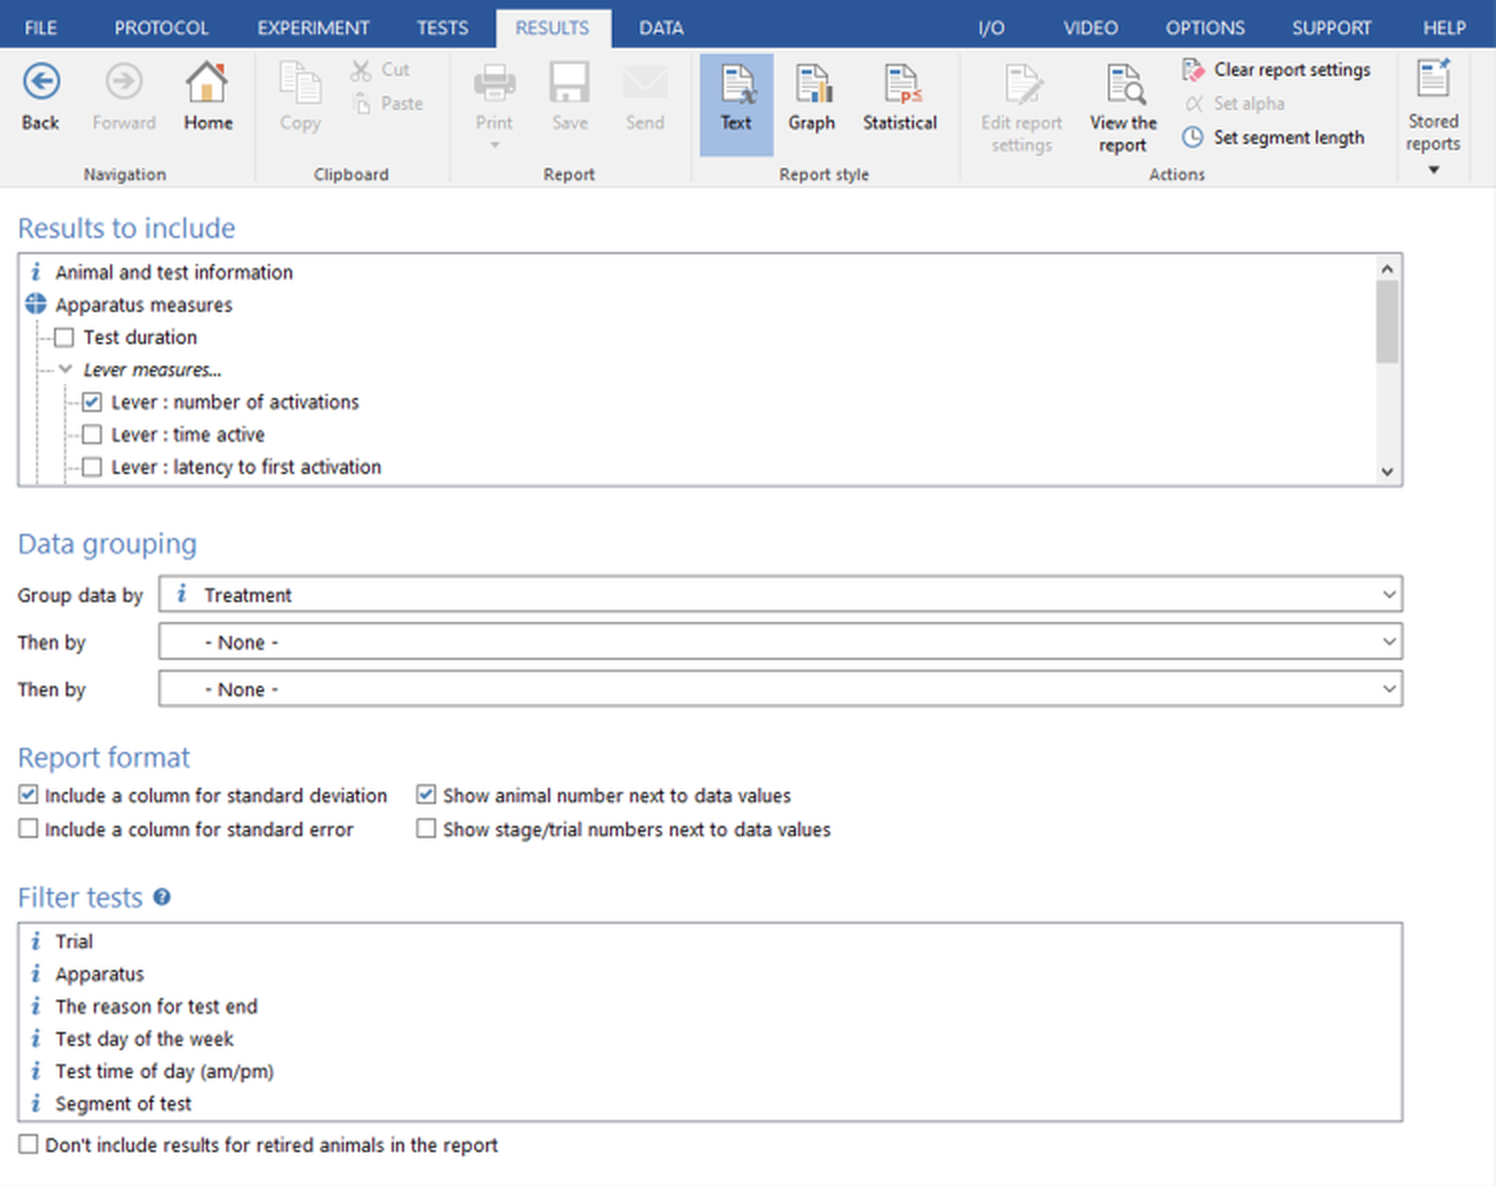
Figure 1. Settings to show the results of 'Lever : Number of activations' for all tests in the experiment, collated by Treatment group.
When you click the ![]() View the report button, you would see something like the report shown in figure 2. I say 'something like', because of course if you are following the steps in this tutorial then your experiment will only include a few completed tests (if any) so you won't see very many results.
View the report button, you would see something like the report shown in figure 2. I say 'something like', because of course if you are following the steps in this tutorial then your experiment will only include a few completed tests (if any) so you won't see very many results.
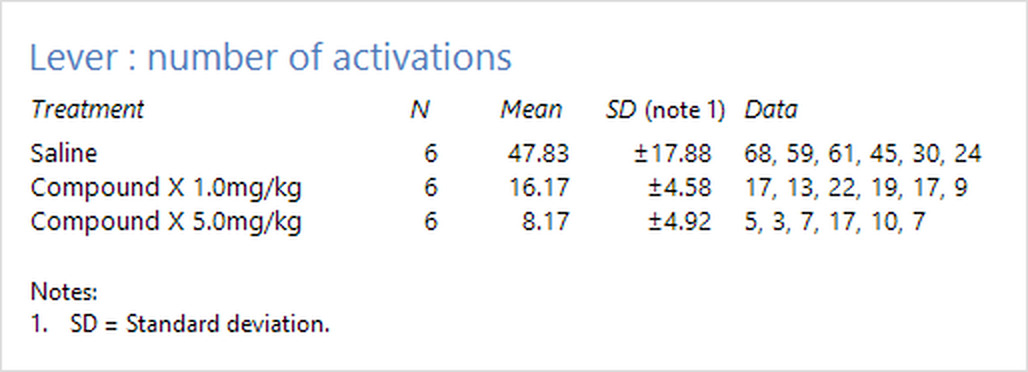
Figure 2. An example of the type of report that is shown when using the settings in figure 1.
You may notice that the ribbon bar includes a section titled Report style. The report shown in figure 2 is a Text style report, but simply by selecting the Graph style we can view the same data as a graph - see figure 3.
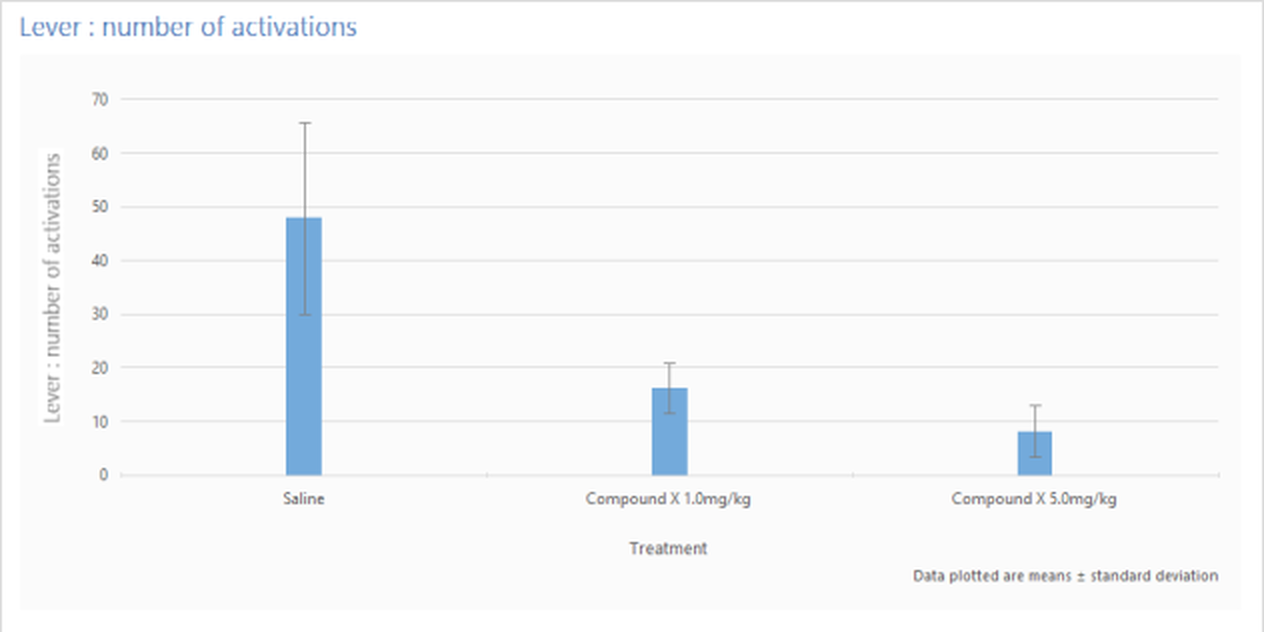
Figure 3. The same results as figure 2, but shown as a graph, rather than text.
Performing statistical analysis of results
In the previous section we looked at the Text and Graph report styles, but there's another style called Statistical. As the name implies, this will perform statistical analysis of your data - figure 4 shows the same data as figure 2 and 3, but analysed using a 1-way ANOVA followed by Tukey's post-hoc test.
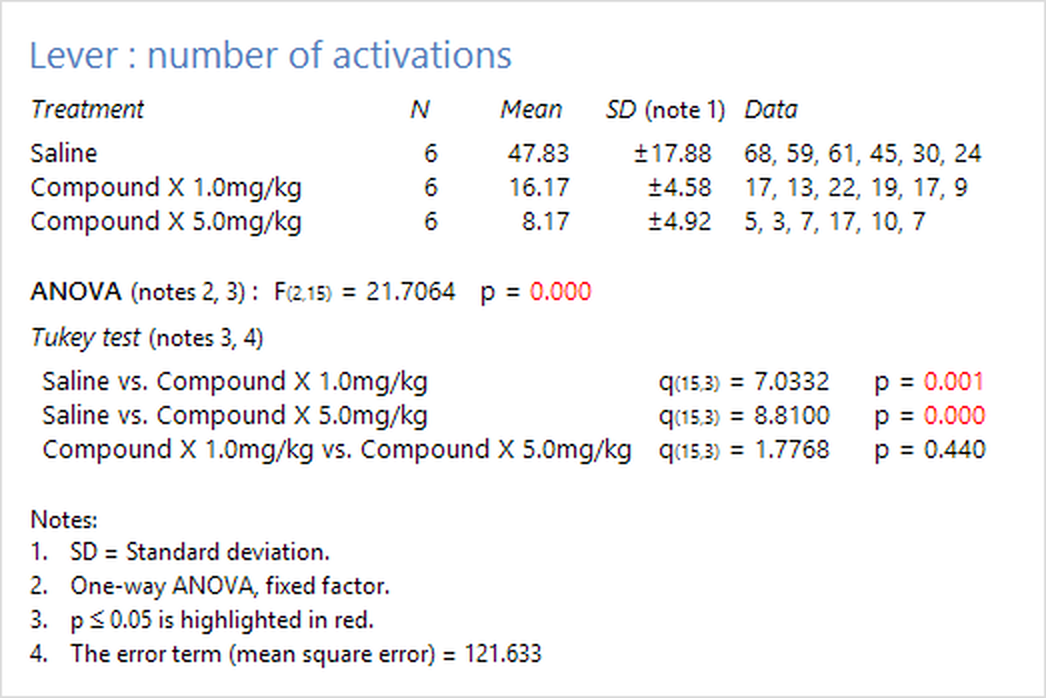
Figure 4. Statistical analysis of the results shown in figures 2 and 3.
The full range of statistical analysis options are beyond the scope of this tutorial, but suffice to say that ANY-maze includes more than 40 different stats tests, including a wide range of post-hoc tests. We don't pretend that ANY-maze is a replacement for a full stats package such as SPSS, but it does provide a quick and easy way to analyse your results and it doesn't require very much knowledge of stats, as it automatically ensures that the stats tests used suit the data being analysed.
Nevertheless, you will probably still want to extract your data from ANY-maze so you can analyse it elsewhere - this is the subject of the last section of this tutorial.
Analysing tests across time
Usually, ANY-maze will report results for entire tests - so you will see data for things like Lever : Number of activations for the whole test duration. However, you may wish to see how the animals' behaviour changed across the duration of the tests - in other words you may want results for different parts of the test, rather than for all of it.
ANY-maze provides two mechanisms for analysing tests across time: you can divide the tests into equal duration segments (sometimes called 'time bins') and then analyse results between the segments; and/or you can define different Time periods and then analyse results for each period individually. Both of these options are described in detail in the Analysis across time topic.
Moving your results elsewhere
While the Results page (described in the previous section) can show all the results of an experiment, it does this in a format that's designed to be easy for you to understand, but which is not very amendable to export to other programs. To view results in a more 'exportable' format, you need to switch to the Data page (by clicking the Data tab above the ribbon bar).
The data page shows the results of an experiment in a spreadsheet format - see figure 5.
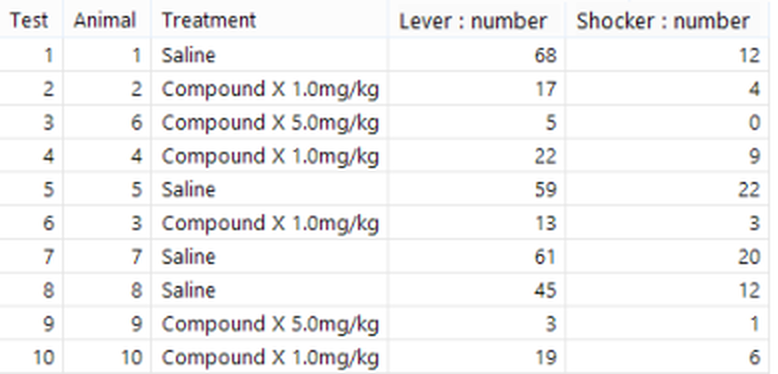
Figure 5. Example of the data page spreadsheet.
The rows of the spreadsheet are the individual tests, while the columns are the results. You can use the ![]() Select data button to switch to a page where you can select the columns you want included, and/or filter the tests, so (for example) only tests for a certain treatment are shown.
Select data button to switch to a page where you can select the columns you want included, and/or filter the tests, so (for example) only tests for a certain treatment are shown.
The spreadsheet can be copied, simply by right-clicking and selecting Copy from the menu which appears, and then pasted directly into programs such as Excel or SPSS. You can also save the spreadsheet to a file, again by right clicking and selecting Save... from the menu that appears.
That's all folks!
That wraps up this ANY-maze Operant interface tutorial. If you've read the whole thing, then you should now have a fairly good idea about how the Operant interfaces and ANY-maze work, and you can probably get started right away performing your experiments.
If you have questions, then you'll find that the help contains a huge amount of information, which you can search. You'll also find that help is context-sensitive, that's to say if you switch to the Help page, you will be shown help on whatever it is that you're doing at the time. (Note that context sensitivity can be switched on and off using an option in the Window section of the Help page's ribbon bar.)
And if you can't find the answer to a question, then just contact ANY-maze Support - we're always happy to help, and we usually respond to questions very quickly.
See also:
| The topics listed below are general topics relating to ANY-maze, and may refer to features not available or required with the ANY-maze Operant interface. |
| • | Viewing results |
| • | Performing statistical analysis |
| • | Printing, copying and saving results |
| • | Transferring data to other programs |
![]()
© Copyright 2003-2026 Stoelting Co. All rights reserved
ANY-maze help topic T1102